
For the next installment in our series of technical articles, Dean Steinke of Dynamic Systems Analysis Ltd., discusses the role of finite element-based simulation and visualization software in mooring design.
He demonstrates this capability with a video of the simulation showing an analysis of our three different ADCP buoy geometries – spherical, elliptical and the unique StableMoor® design.
Mooring System Numerical Modeling
“Don’t let the ocean knock you down.”
Using dynamic analysis software to assess mooring deployment, recovery, and performance in current and waves.
By Dean Steinke, PEng – April 5, 2017
Introduction
For many years moorings have been designed using basic mass-drag-buoyancy calculations, spreadsheets, rules-of-thumb, black magic scripts, and a dose of ‘salty-sea-dog’ experience. With these methods, we can frequently estimate a line size to use or an approximate anchor weight. But sometimes despite our experience we still have questions. This article looks at increasing the precision of mooring analyses using numerical modeling software designed for ocean engineers.
Software for single point moorings has come a long way in recent years. Finite element-based cable analysis programs have been tested and developed by oceanographic institutions and ocean engineers for various purposes (towed bodies, ROVs, moorings, etc.). However, their use has been typically limited to a few advanced numerical modelling specialists who had both the expertise and patience to wade through the complex analysis process. In recent years, increasingly-refined software has been developed. This software has benefited from increased computational power and advances in 3D graphics. We can now get a much clearer picture as to what is happening with our moorings subsurface through simulation and visualization.
The video below demonstrates an analysis carried out by my firm, Dynamic Systems Analysis Ltd, using our ProteusDS software. Based in Canada, we have cut our teeth over the last decade simulating many different types of ocean technologies, including single point moorings.
Analyzing Buoy Pitch and Knockdown in Current
The video shows four buoys of various styles (spherical, ellipsoid, and streamlined) being loaded by current. As the current ramps up to 3.6 knots, the knockdown and pitch of the buoys increase. There are two key forces at play – buoyancy and drag. The buoyancy provides a vertical restoring force that keeps the buoy from pitching. Conversely, hydrodynamic drag pitches the buoys about their mooring connection point.
A pitch of greater than 20 degrees is not recommended for ADCPs, as the inclinometers which allow for compensation of buoy pitch typically only have a range of 20 degrees. Mooring designers would try to limit ADCP buoy pitch to only a few degrees if possible. In addition to uplift and drag, buoy pitch also depends on the length of the mooring and weight of mooring equipment (chain, shackles, line, etc.).
The example shows that increased buoyancy is effective in preventing knockdown and limiting pitch, as the AF49-750 buoy has the lowest pitch and knockdown of the elliptical and spherical buoys. However, this buoy still pitches significantly at the higher currents, whereas the streamlined StableMoor® buoy, with its reduced drag and configurable connection point, is effective at maintaining low pitch and knockdown.
The ProteusDS model uses 6 degrees of freedom for the buoys (heave, sway, surge, roll, pitch, and yaw). Although this case is essentially 2D, the solver solves for the position in 3D. The effect of the attachment point and location of drag loading affect the pitch calculated by the software.
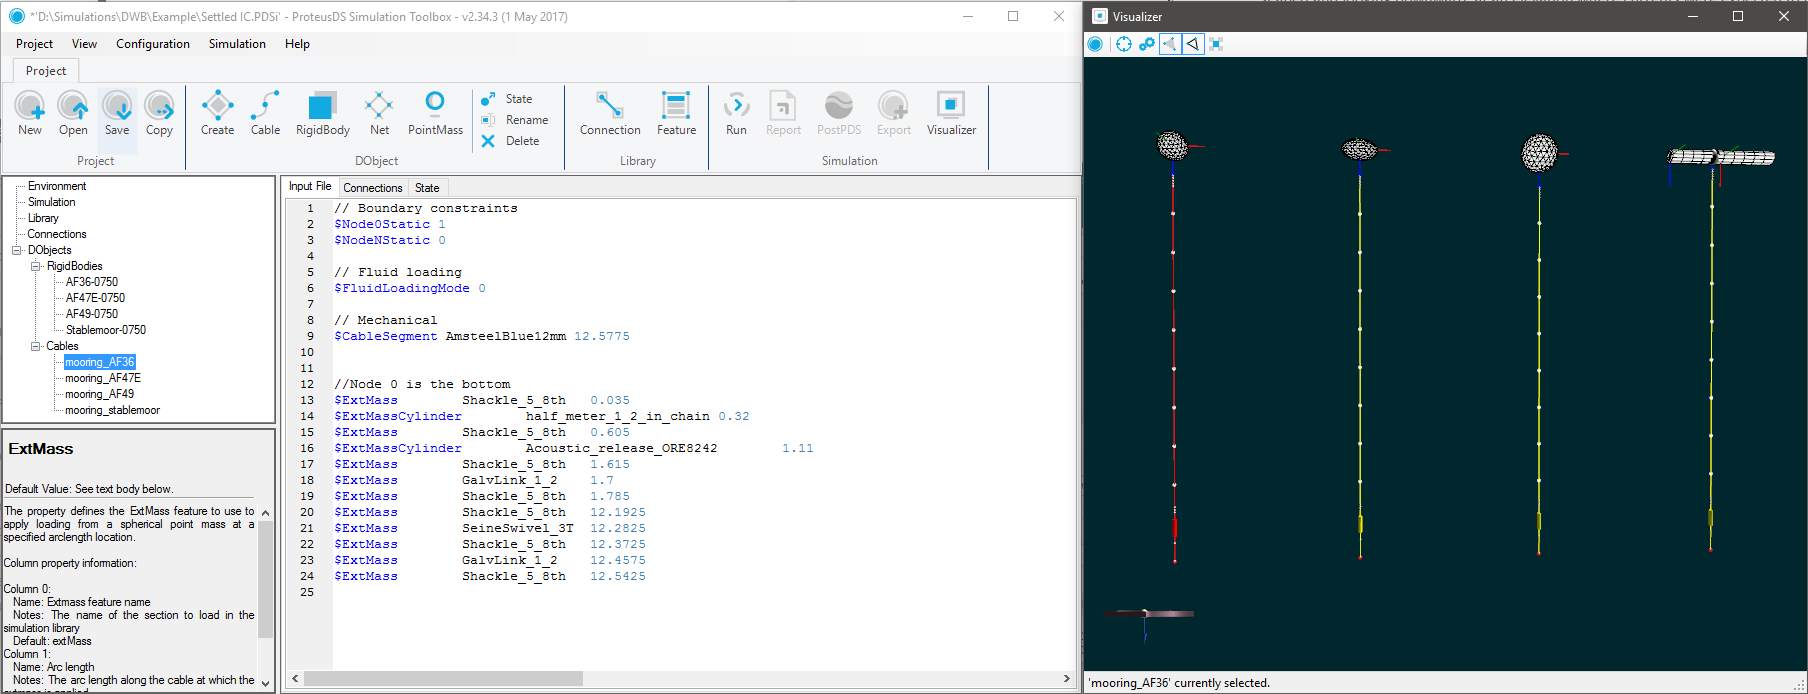
Figure 1 The ProteusDS software pre-processor is shown. This software allows users to add mooring elements such as shackles and swivels from a central library. Line types such as Amsteel Blue or wire rope can likewise be selected.
Transient Loading and Acoustic Release Damage During Mooring Deployment
One aspect not often considered by mooring designers is what happens during deployment. As shown in the video, the simulation allows for prediction of launch transients, which ensures that shackles and lines are properly selected to handle the deployment loads.
We’ve observed that acoustic releases get damaged during deployment when they are placed too close to the anchor. ProteusDS can be used to check that the acoustic release’s downward momentum will not cause it to crash into the seabed or anchor.
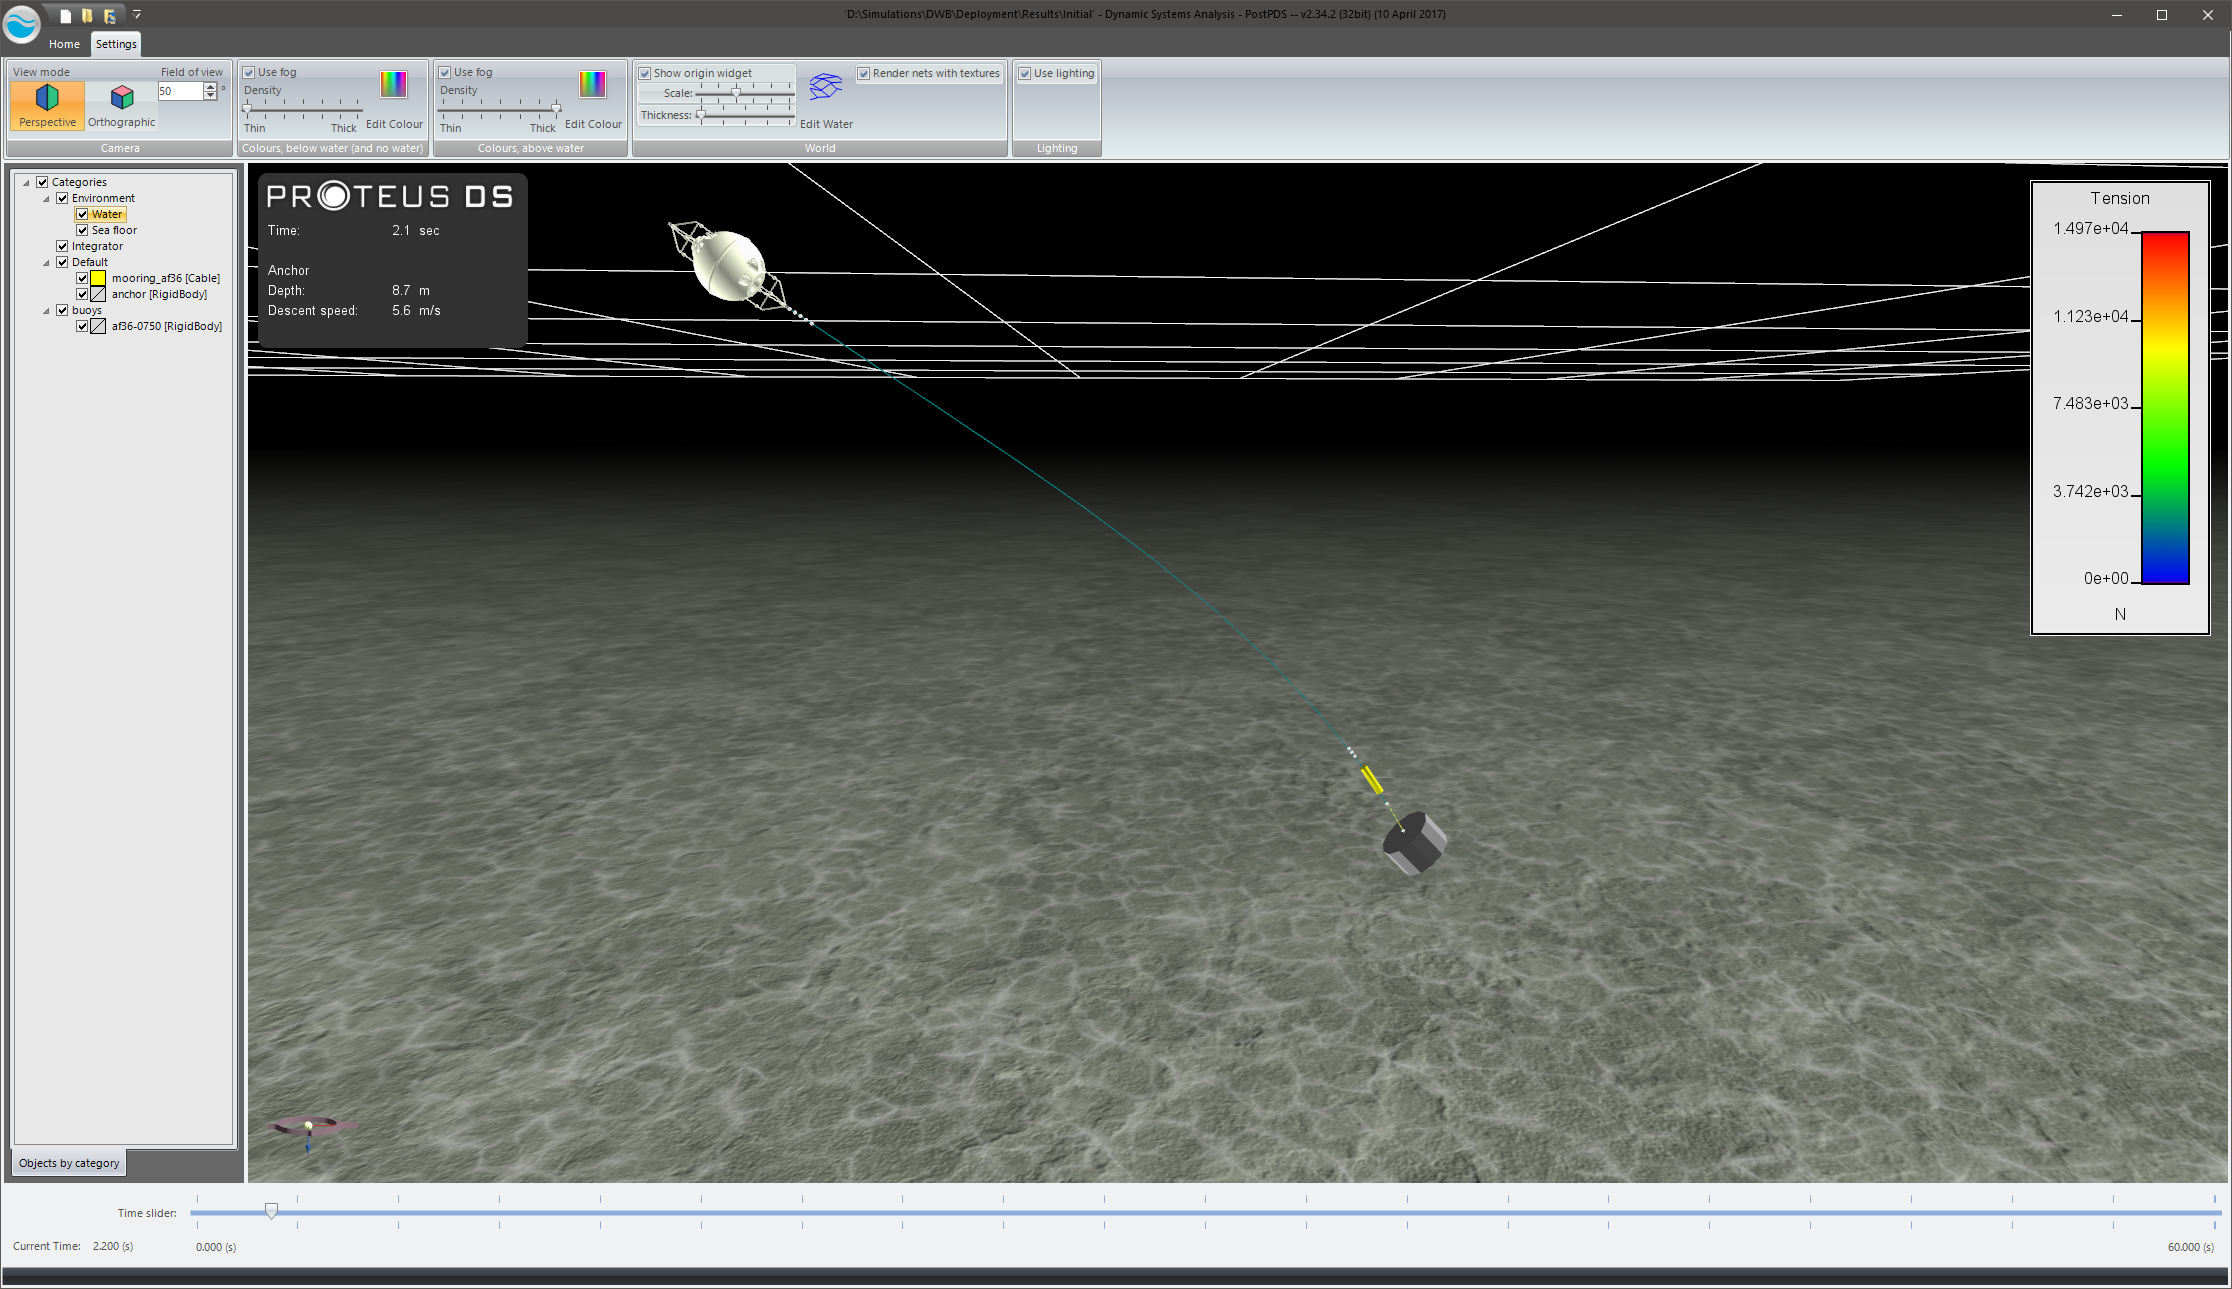
Figure 2 Mooring deployment analysis showing launch transient loading.
Mooring System Recovery
A few questions I’m asked from time to time are: How long will it take for the mooring to come to the surface? and, How far might the mooring drift as it comes to the surface? The mooring recovery section of the video shows how you can assess this.
In the case considered, the AF36-750 mooring rises at about 2.7 meters per second. If this mooring was deployed at 750 meters, it would take between 4 and 5 minutes to surface!
Although no current was applied in the example, current can be applied in the simulation to determine how far it might drift in the time it takes to get to the surface.
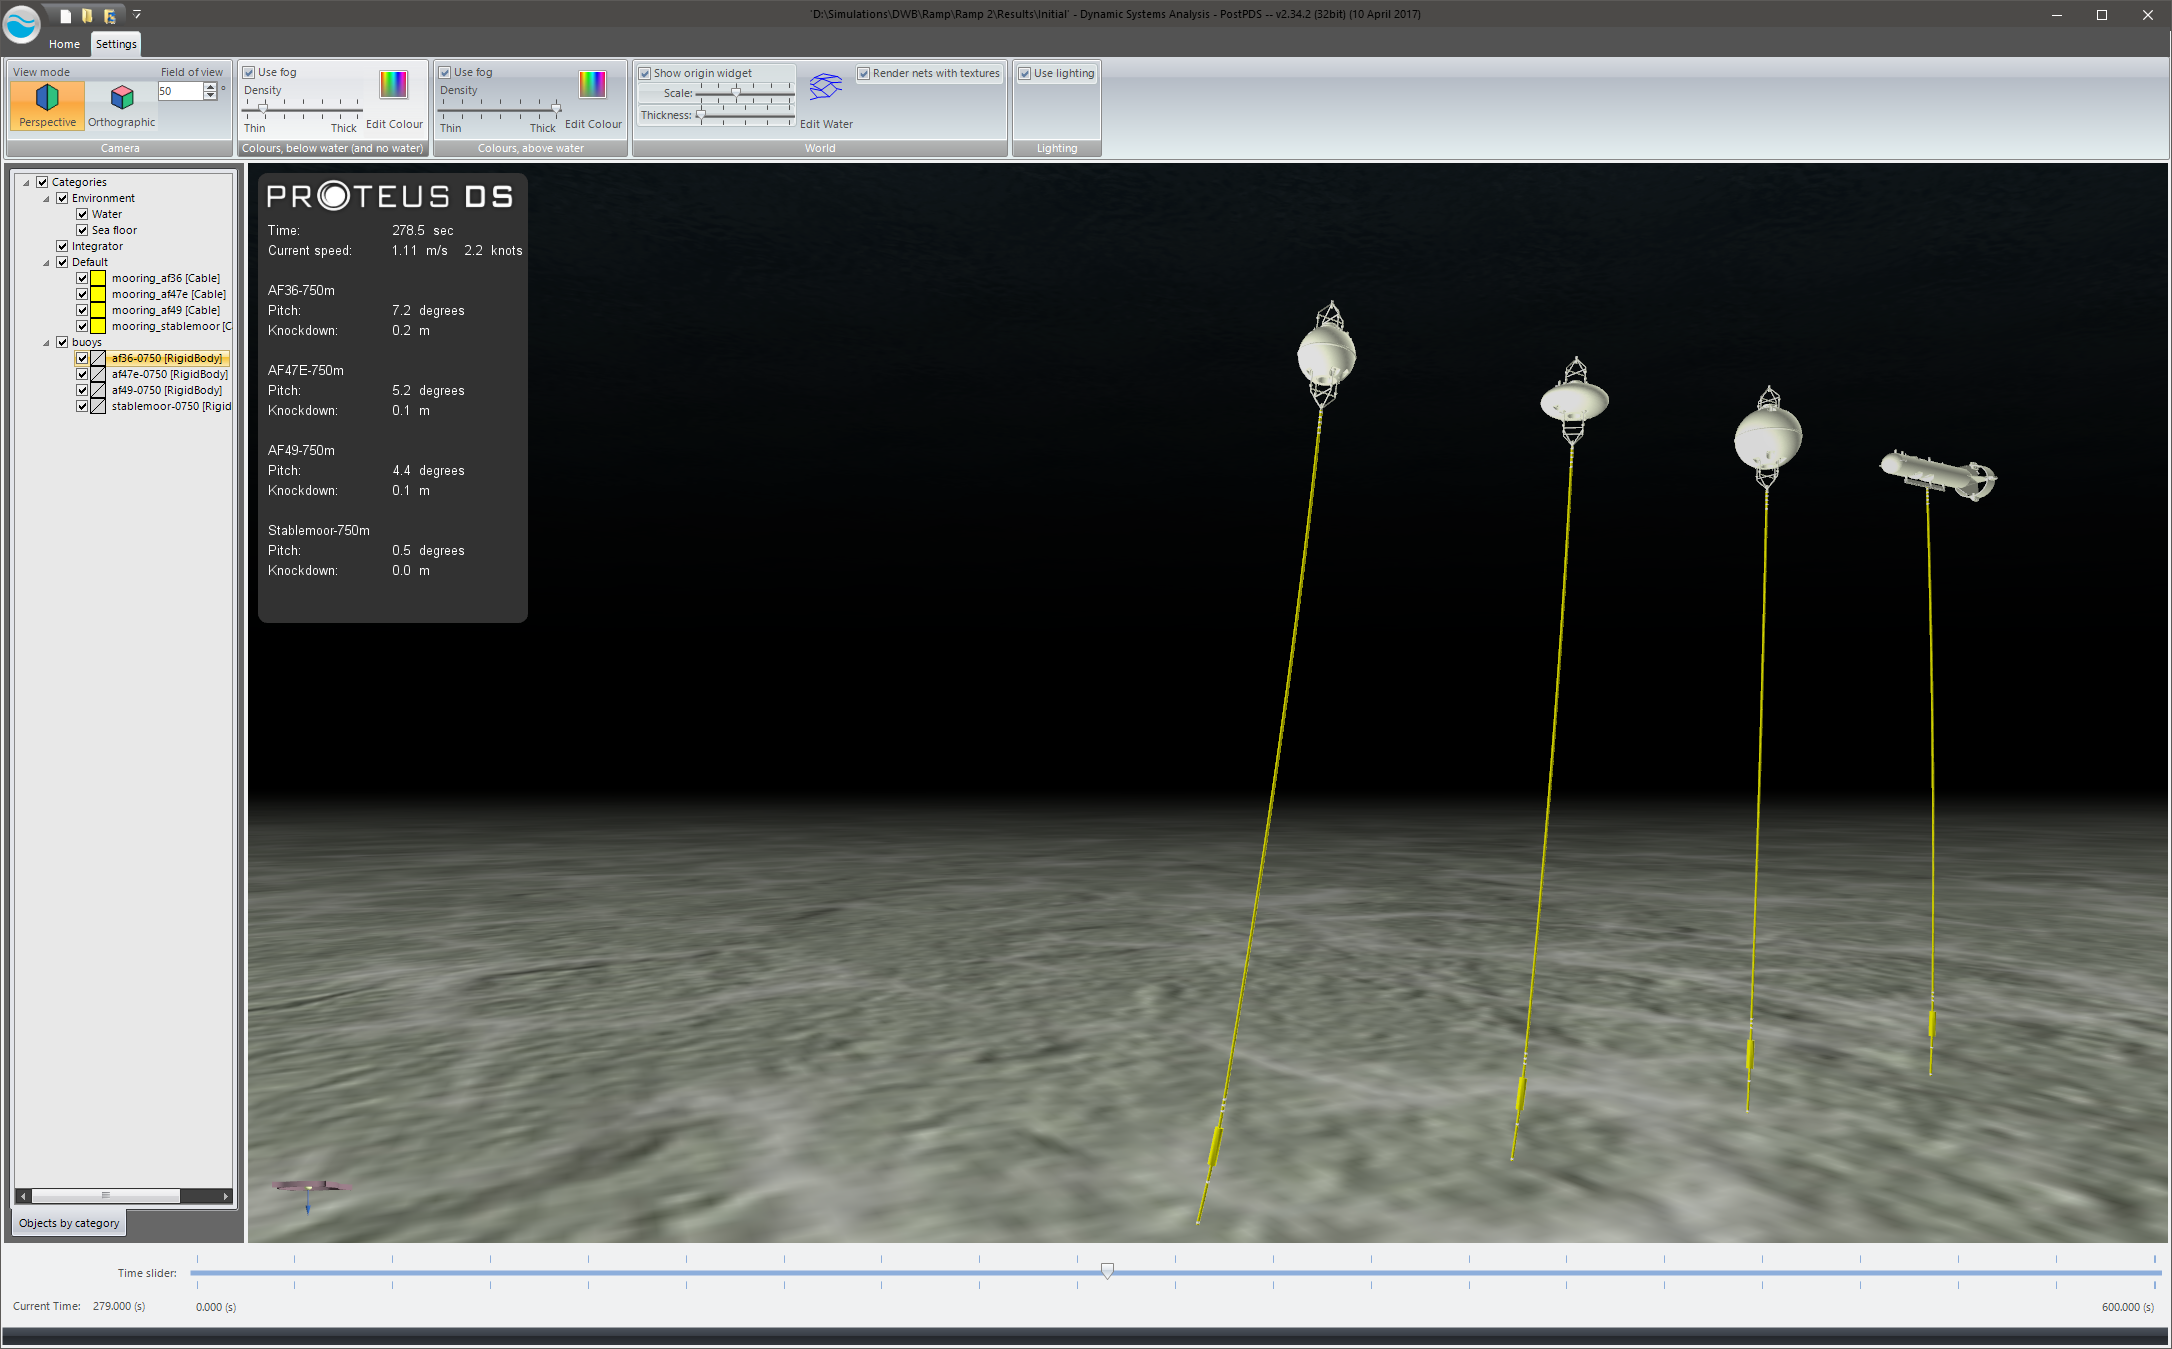
Figure 3 ProteusDS post-processing software showing rendered view of the mooring systems being tested.
Interaction of Waves with Subsurface Moorings
Much like current, waves can cause an ADCP mooring to pitch and move. The example in the video shows the impact of the subsurface orbital wave motion on the mooring line and buoy. A JONSWAP wave spectrum is simulated to check how much the buoy will pitch. Clearly, in this case, a bottom mounted ADCP frame would be preferred – but we don’t always have the equipment we need on hand. It’s good to have tools to check the impact of waves on our moorings.
Conclusions
DSA has carried out a series of simulations in consultation with DeepWater Buoyancy using our ProteusDS software. The software is designed to help mooring designers and builders to answer practical questions about mooring performance. Most would agree that the software’s 3D visualization capabilities shown in the video are really cool, but I believe that the real value of the software is that we don’t have to speculate what is happening subsea. We can now get a clear picture.
About Dynamic Systems Analysis Ltd.
Dynamic Systems Analysis Ltd. is an ocean engineering consultancy and software company based in Canada. DSA provides progressive and accessible dynamic analysis expertise and software to enable those working with vessels, structures, lines and technologies in harsh marine environments to reduce risk. DSA provides software and services to the aquaculture & fisheries, defence, marine renewable energy, naval architecture, ocean technology, and offshore sectors.
Learn more at www.dsa-ltd.ca
About DeepWater Buoyancy, Inc.
DeepWater Buoyancy creates subsea buoyancy products for leading companies in the oceanographic, seismic, survey, military and offshore oil & gas markets. Customers have relied on our products for over thirty years, from the ocean surface to depths exceeding six thousand meters.
Learn more at www.DeepWaterBuoyancy.com