For the next installment in our series of technical articles, Ryan Nicoll of Dynamic Systems Analysis, Ltd. (DSA) looks at controlling uncertainty in buoy drag coefficient when designing oceanographic moorings.
Ryan is the Chief Technical Officer of DSA and has vast experience in both software development and use of software in oceanographic mooring design.
How to Control Uncertainty in Buoy Drag Coefficient when Designing Oceanographic Moorings.
By Ryan Nicoll, PEng – CTO of DSA, Ltd.
Introduction
It was the summer of 1991 and I stood in front of the first hedge maze I’d ever seen before. What could be more fun to a young boy that getting lost in a hedge maze and finding your way out?
I had a simple plan: get totally lost as quickly as possible by making random choices. Then I’d take my time to find my way out. So, I ran straight in at full speed, turning left or right at each turn without thinking about it.

Ryan’s first strategy for solving hedge maze: run fast, think later!
The plan completely backfired. By a complete fluke, within a minute or two, I made it to the exit of the maze. I couldn’t believe that I got straight to the end of the maze by making random decisions.
Making random decisions may work once in a while in solving a hedge maze. But you can’t make a random decision for a drag coefficient for an oceanographic buoy. These buoys can be substantial structures. Because they’re substantial, the drag forces on them can also be substantial. If they have even remotely complex shapes, it’s difficult to really know what the drag coefficient is.
We’re going to look at three ways to evaluate oceanographic buoy drag coefficients. These ways increase in complexity but still give you something to start with. These three ways to determine the drag coefficient are using:
- Lookup tables
- Computational Fluid Dynamics (CFD)
- Field deployment data
First, we’re going to cover the use of lookup tables.
Lookup tables are a fantastic starting point
They provide drag coefficients for quite specific shapes and geometries. Helpfully, there are often tables with parameters that help you zero in on your particular shape. For example, a lookup table for a squat cylinder shows a few different values of drag coefficient based on the length to diameter ratio. Lookup tables are easy to use. You find the shape that is closest to what you’re working with, and then that’s the drag coefficient that you use in your calculations.
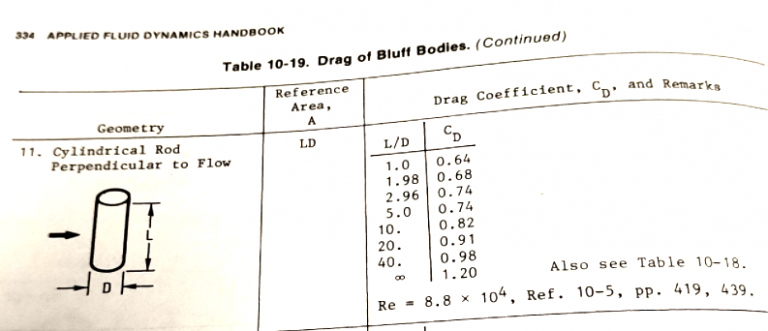
Cylinder drag coefficient lookup table from Applied Fluid Dynamics Handbook by Blevins
Where do these lookup tables come from?
These lookup tables are the results of decades of research and experiments. These experiments measured the total drag force on these shapes in different flow conditions. The resulting drag coefficient is computed from the data and then published in the lookup tables for future reference.
But there are also quite a few limitations
It’s rare to get an exact match to the shape you want. Even with basic shapes like cylinders, your particular form may be out of range of the lookup table. Or you may have only a few examples to work with from the lookup tables you have on hand.
So, while lookup tables give you a starting point, it still leaves some uncertainty. This takes us to the next approach that can be used to resolve the drag coefficient: computational fluid dynamics (CFD).
You can work directly with your specific buoy geometry
Previously, we learned that lookup tables were produced by decades of painstaking research and experiments that measured the total drag force on actual structures. CFD software calculates the dynamics of fluids flowing past structures. Essentially, you can use CFD to run your own virtual experiment on your specific structure directly on your computer.
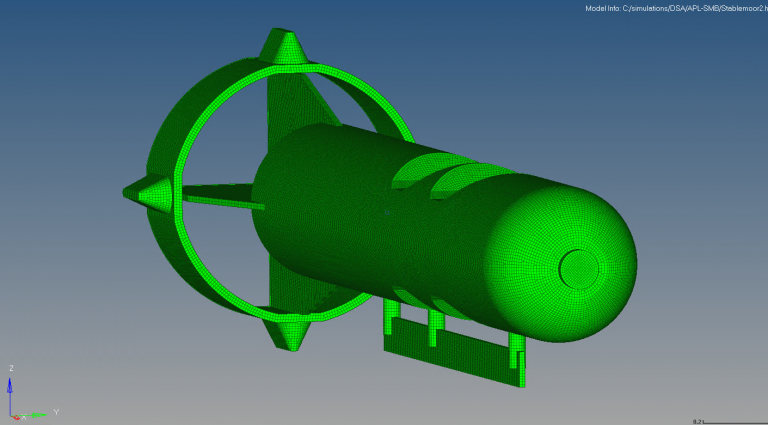
Pre-processing StableMoor® geometry in Altair HyperMesh in preparation for CFD analysis in Altair AcuSolve
Almost any kind of geometry can be used in a CFD tool. Software tools like Altair HyperMesh make it easy to work with 3D models generated from CAD software. This software prepares the geometry for use in a CFD program like Altair AcuSolve. Regardless of the CFD program used, once the geometry is in place, you can set the water flow conditions you want to check. Then, when you run the program, it calculates the corresponding drag coefficient for that geometry in those conditions. This is a significant improvement from lookup tables because you can use much more precise geometry. You aren’t left trying to guess which shape best fits your specific oceanographic buoy.
But there’s a different kind of uncertainty when working with CFD
As incredible as CFD tools are, the dynamics of fluid flows can be incredibly complex. There are also many inputs and settings for the CFD flow physics models. In some particular circumstances, some of these settings can make substantial changes in the output of the drag coefficient calculations. So how do we deal with this new kind of uncertainty? This brings us to the next and final section, validation with field deployment data.
Nothing is more real than reality
If you put an oceanographic buoy in a known water current and you can measure the total drag force, well, you’ve got the actual drag coefficient! Of course, it makes sense that this would eliminate those niggling uncertainties that remain with the previous two methods. We are indeed working with the exact shape, unlike the lookup tables. And we are working with real water flows, unlike an approximation of the water flow as calculated by CFD.
This creates a bit of a chicken and egg problem
We do need to know in advance what the drag coefficient is before we design and deploy the mooring. Otherwise, the mooring is at risk if it deflects far too much, or if it breaks. However, these risks can be controlled with a staged approach using a smaller mooring in lower flow speeds, or even scale model tests in a flow tank. These scale model tests are the kinds of tests done over decades of research to make lookup tables.
What about the cost of a field deployment?
Of course, making a field deployment is incredibly complex and expensive. You need a ship and crew to deploy the equipment. The equipment itself is costly as well. It can be a complicated job to just measure the flow at a site, never mind also some characteristic of the mooring response. But that only shows how unique and valuable the knowledge of the specific drag coefficient is for that particular structure. And that drag coefficient can be used again for new mooring designs and for different locations with different flow speeds in the future.
Let’s look at a specific example
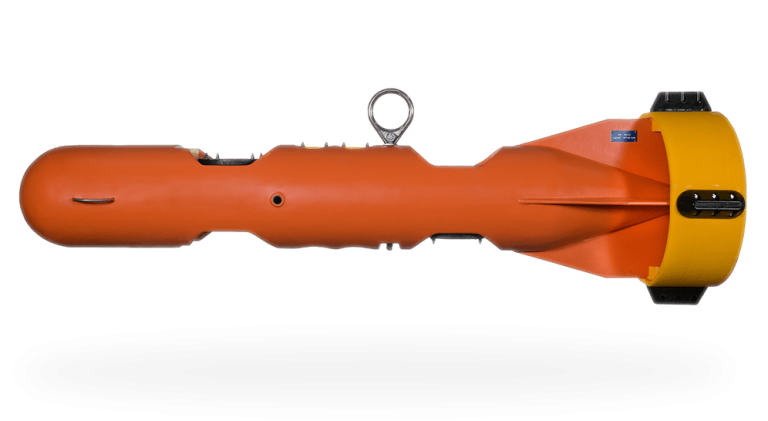
DeepWater Buoyancy’s StableMoor® Buoy is a streamlined float designed to work in high flow conditions. It’s a fairly specific shape. When reviewing lookup tables, there are a few examples that are pretty close, but not exact. Is it more like a rounded rectangle, or cylinder? How can the tail ring be accounted for? There’s only so much we can answer using this approach. The rounded block has a range of 0.25 and 0.55, so we could try 0.55. It may seem a bit random, but that’s the best we can do at this stage. The next stage is using a CFD software tool.
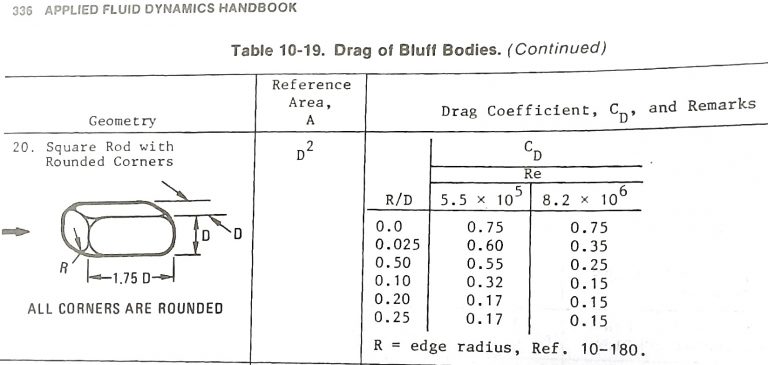
Lookup table drag coefficient values for rounded block from the Applied Fluid Dynamics Handbook by Blevins
We used the CFD program Altair AcuSolve to compute the drag forces on the actual geometry of a StableMoor Buoy in a few flow speed conditions. Based on the projected area from the main hull, the CFD calculated drag coefficient is 1.0. This is higher than the rounded block lookup table values because the tail ring adds extra drag to the system. At this stage we have a good idea of the buoy drag coefficient to use. To improve on this, the final stage is a validation using field data.
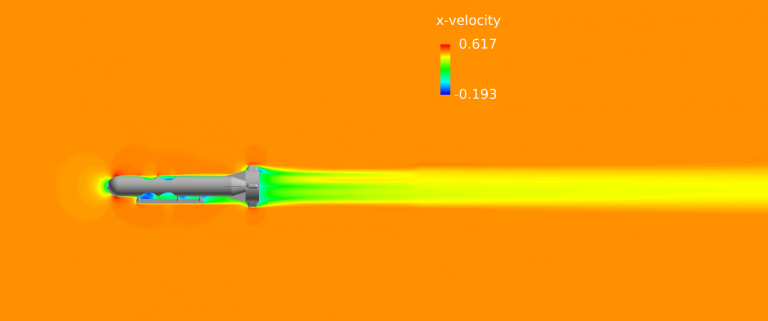
Altair AcuSolve CFD calculations show the flow structure surrounding the StableMoor® Buoy
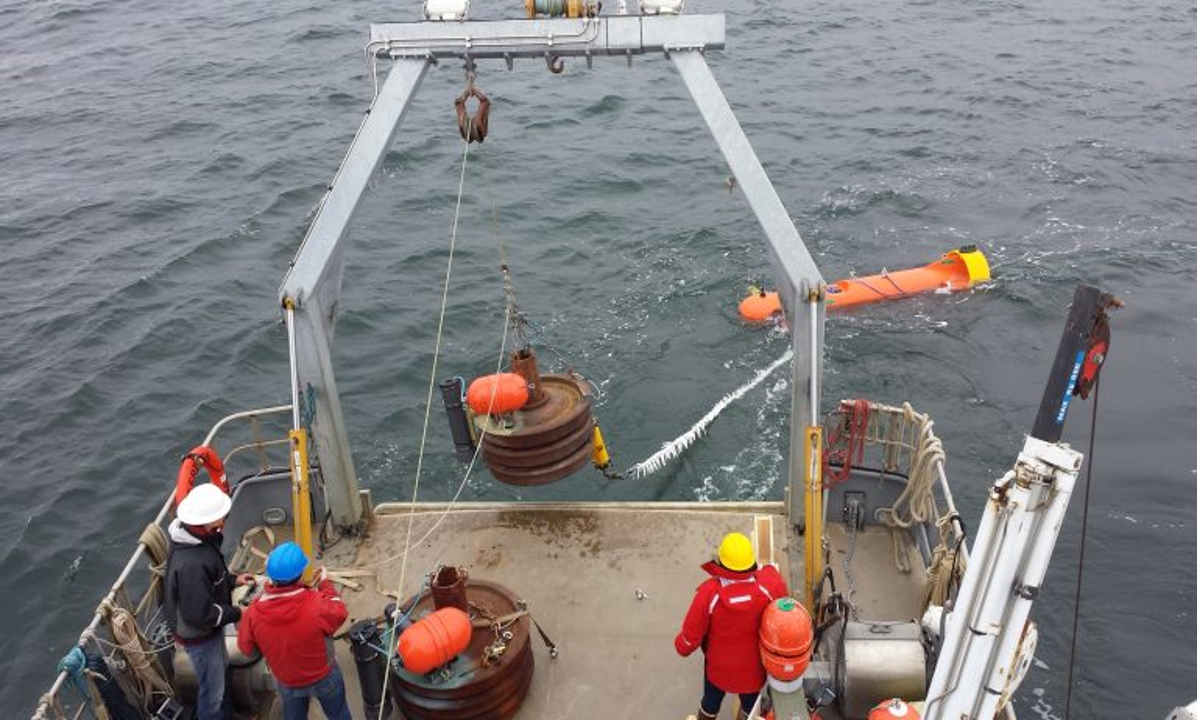
Oceanographers at the UW Applied Physics Laboratory deployed a short mooring with a StableMoor Buoy® in a high flow tidal channel. The onboard sensors measured the flow velocity as well as the altitude of the StableMoor® Buoy off the seabed. As the total drag forces on the mooring and StableMoor® Buoy deflect the system, the altitude of the StableMoor® Buoy decreases. This reduction in altitude is often called knockdown.
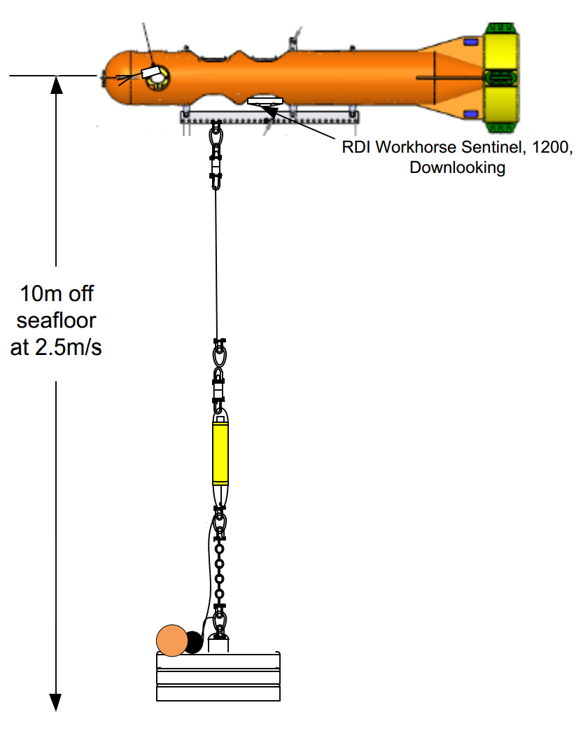
APL mooring schematic with StableMoor® Buoy.
We reconstructed the mooring in ProteusDS to compare the results to the measured the knockdown. Using a drag coefficient of 1.0 for the StableMoor® Buoy showed knockdown within the measured range of values from the field deployment: at about 2m/s flow speed, the system shows about a 1m knockdown. So this looks like the CFD software tool did a pretty good job. This builds confidence to use the drag coefficient and the CFD analysis process again for other mooring designs.
We covered a lot of ground in our search for ways to find a drag coefficient
Now it’s time for a quick review. A starting point to resolve a drag coefficient is to use lookup tables. These represent decades of work from real experiments on various shapes. But often there’s not an exact fit to the oceanographic buoy geometry you’re working with.
The next step is to try using a CFD software tool. These software tools can use the specific buoy geometry you’re working with and provide you with the drag coefficient. While these software tools are powerful, they are still an approximation to potentially very complex fluid physics.
Indeed, there’s no replacement for reality, and so the final step would be some kind of real measurement of the buoy in actual flow conditions. While this can be a massive effort, it does provide a valuable validation of the drag coefficient for a particular buoy that can be used again in similar conditions.
Working with drag coefficients may make you feel like you are running around in a maze
You can’t just pick a drag coefficient randomly, rush on to the next step in the mooring design process, and expect success. You may be doing this if you have only a limited lookup table to work with.
Next step
Request a demo license for ProteusDS and explore how the knockdown of your specific mooring configuration can change with different drag coefficients. Use the parts library to get a good starting point in evaluating oceanographic mooring knockdown quickly.
Thanks to APL and DeepWater Buoyancy
Thanks to Jim Thomson and Alex de Klerk from APL and David Capotosto and Dan Cote from DeepWater Buoyancy for sharing technical pointers and information on the mooring deployment and StableMoor® Buoy.
About DeepWater Buoyancy, Inc.
DeepWater Buoyancy creates subsea buoyancy products for leading companies in the oceanographic, seismic, survey, military and offshore oil & gas markets. Customers have relied on our products for over thirty-five years, from the ocean surface to depths exceeding six thousand meters.
Learn more at www.DeepWaterBuoyancy.com
About Dynamic Systems Analysis Ltd.
Dynamic Systems Analysis Ltd. is an ocean engineering consultancy and software company based in Canada. DSA provides progressive and accessible dynamic analysis expertise and software to enable those working with vessels, structures, lines and technologies in harsh marine environments to reduce risk. DSA provides software and services to the aquaculture & fisheries, defence, marine renewable energy, naval architecture, ocean technology, and offshore sectors.
Learn more at www.dsa-ltd.ca