/category/all-products/spherical-adcp-buoy Archive


Buoy Conversion Kit for Teledyne RDI Pinnacle ADCP
Buoy Conversion Kit for Teledyne RDI Pinnacle ADCP

Announcement

In a joint product release with Teledyne RDI, DeepWater Buoyancy announced a new product – the Buoy Conversion Kit for Teledyne RDI Pinnacle ADCP

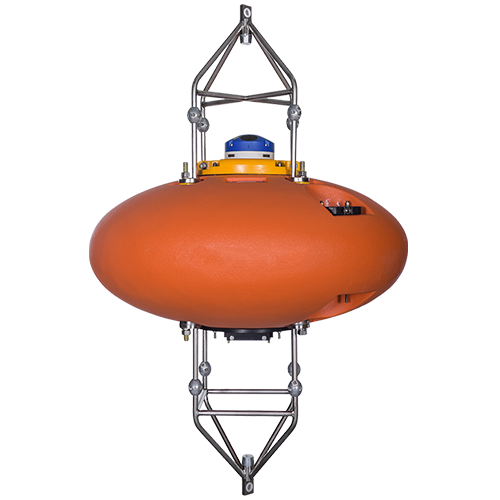
This kit allows the use of Teledyne RDI’s new Pinnacle ADCP on existing DeepWater Buoyancy ADCP buoys.

Designed in collaboration with Teledyne Marine’s Product Development Team, the kit includes an ADCP clamp, top frame, and lift strap system.

About the ADCP Buoy Conversion Kit

DeepWater Buoyancy collaborated with the Teledyne RDI product development team throughout the design of the Pinnacle ADCP.  Features were incorporated into the Pinnacle housing to allow for secure mounting of the instrument in DeepWater Buoyancy ADCP buoys. Darryl Symonds, Director of Marine Measurements Product Lines for Teledyne RD Instruments said, “We have been working with the DeepWater Buoyancy team (formerly Flotation Technologies) for decades.  This latest collaboration on the Pinnacle product is just the most recent in a long history of successful co-design that started with the very first subsea spherical ADCP buoy in 1986.” 

The kit consists of three assemblies: the clamp, the frame and the buoy lifting straps.

The Clamp

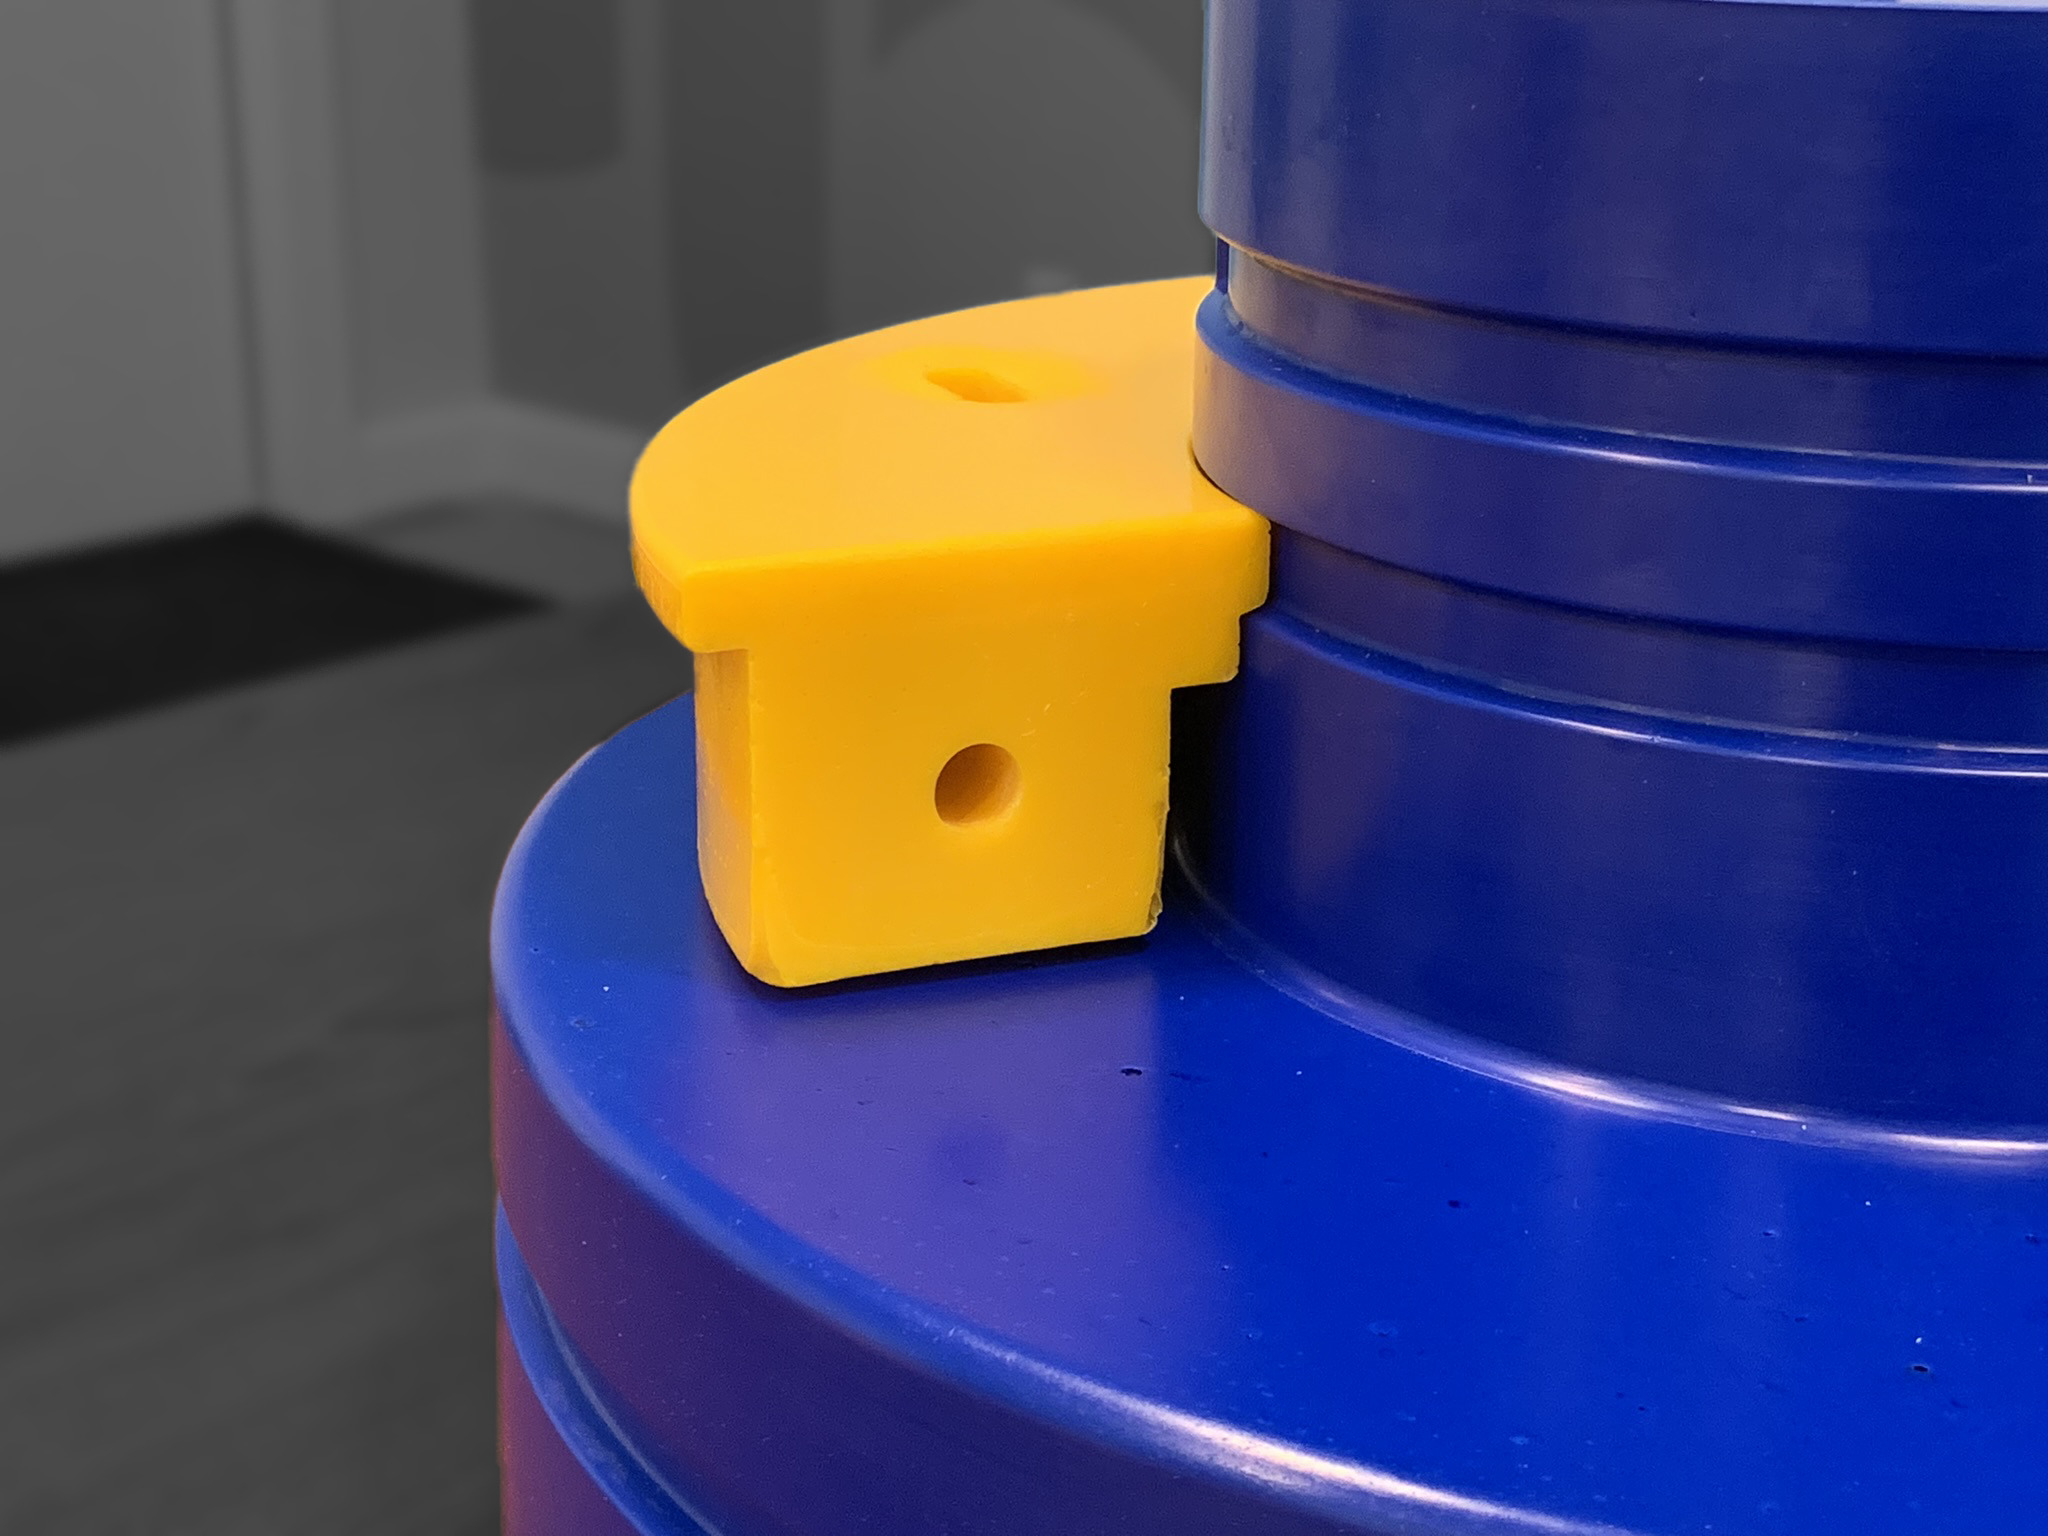
The clamp is similar to the standard ADCP clamp in that it is made of urethane and fastened with titanium hardware for superior corrosion resistance.  It is unique, however, in that it has a “keying” feature that ensures that the Pinnacle is “clocked” correctly.  Unlike a standard ADCP, the Pinnacle has no obvious “lobes” to ensure that the beams pass between the top frame legs.  Instead, it has a flat face.  So the joint engineering team placed a key on the Pinnacle housing to match a feature on the clamp to ensure beam location.

In addition to this key, there is a slot in the Pinnacle housing that matches a rim in the clamp.  This ensures that there is no axial movement of the instrument during handling and deployment. 
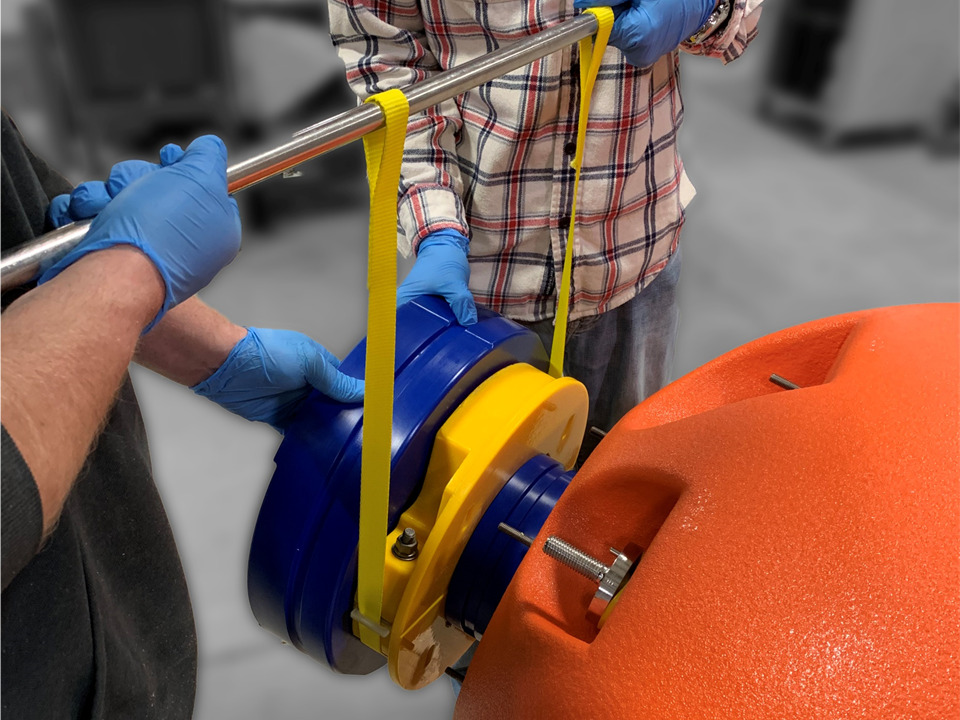
The clamp has composite loops that allow a fiber lifting strap to be passed through.  These straps allow for safer and easier handling and mounting of the ADCP into the buoy.
The Top Frame

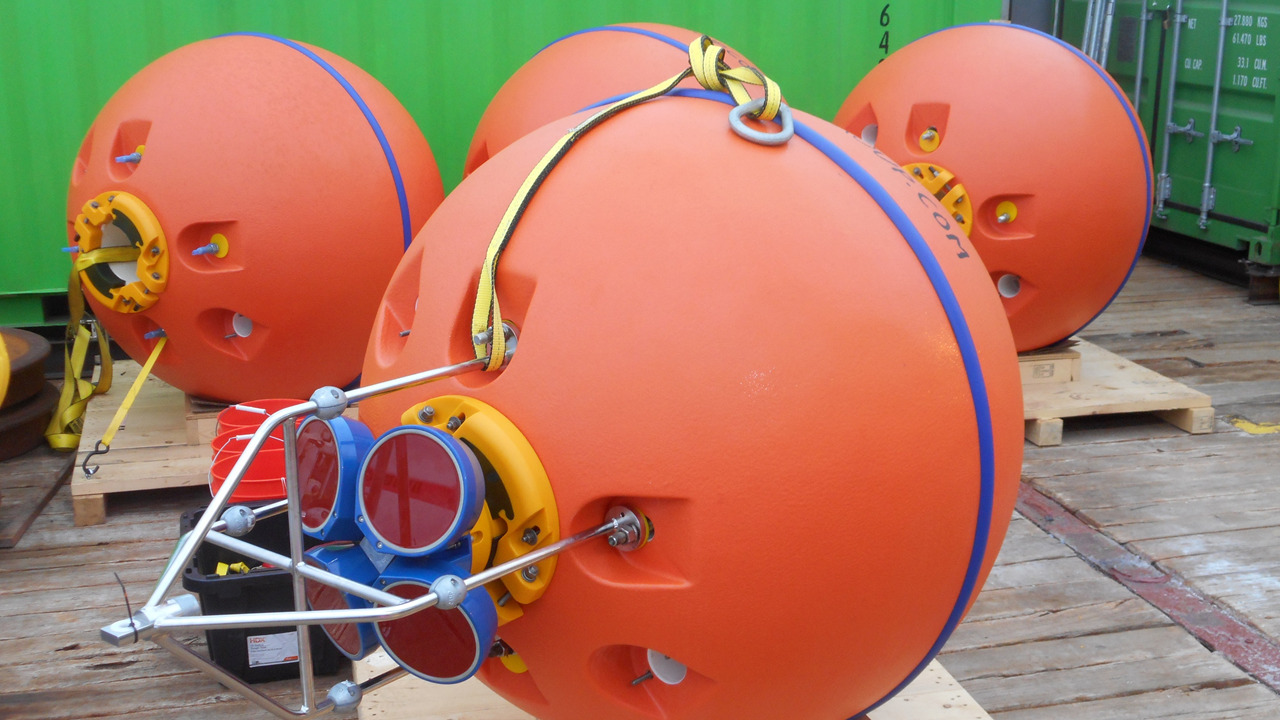
The conversion kit frame is noticeably longer than a standard ADCP frame.  This is to provide the appropriate space above the transducer face for the acoustic beams to develop. Additionally, the frame has a feature to allow the connection of the Buoy Lifting Strap for safe handling.

Like all DeepWater Buoyancy ADCP frames, it is manufactured with 316L stainless steel. It is then electropolished and fitted with replaceable zinc anodes for superior corrosion resistance. The frame arbor is fitted with isolation bushings and allow connection to the mooring line with standard shackles.

The Buoy Lift Strap System

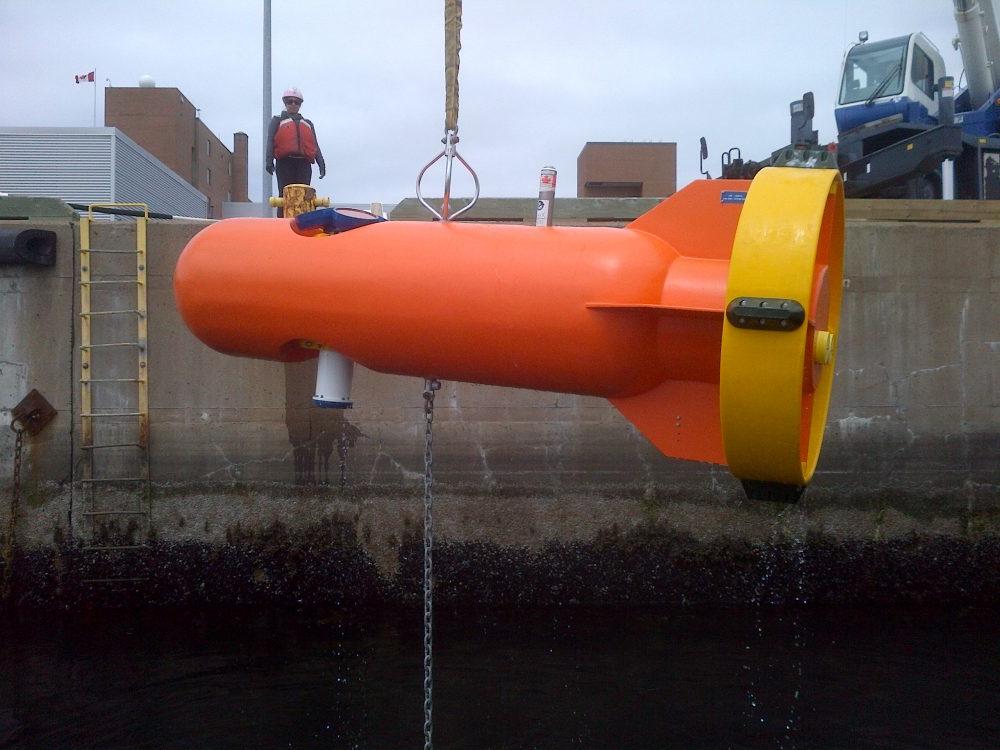
Also included in the conversion kit is a Buoy Lift Strap System.  Designed with Ocean Engineer Jon Wood of Ocean Data Technologies, the strap system allows for safe deployment and retrieval of the buoy.  The strap allows the buoy to be lifted without placing unnecessary stress on the extended frame members and for the buoy to be lifted with its axis horizontal.  In addition to the safeguarding of frame and instrument, the horizontal lift allows for a shorter lift height to minimize the A-frame and hoist specifications necessary for deployment and recovery.  Jon Wood also points out, “In addition to being a tool for deployment and recovery, the strap system appears to act as a vane and reduces spinning motion of the buoy.”
About the Pinnacle

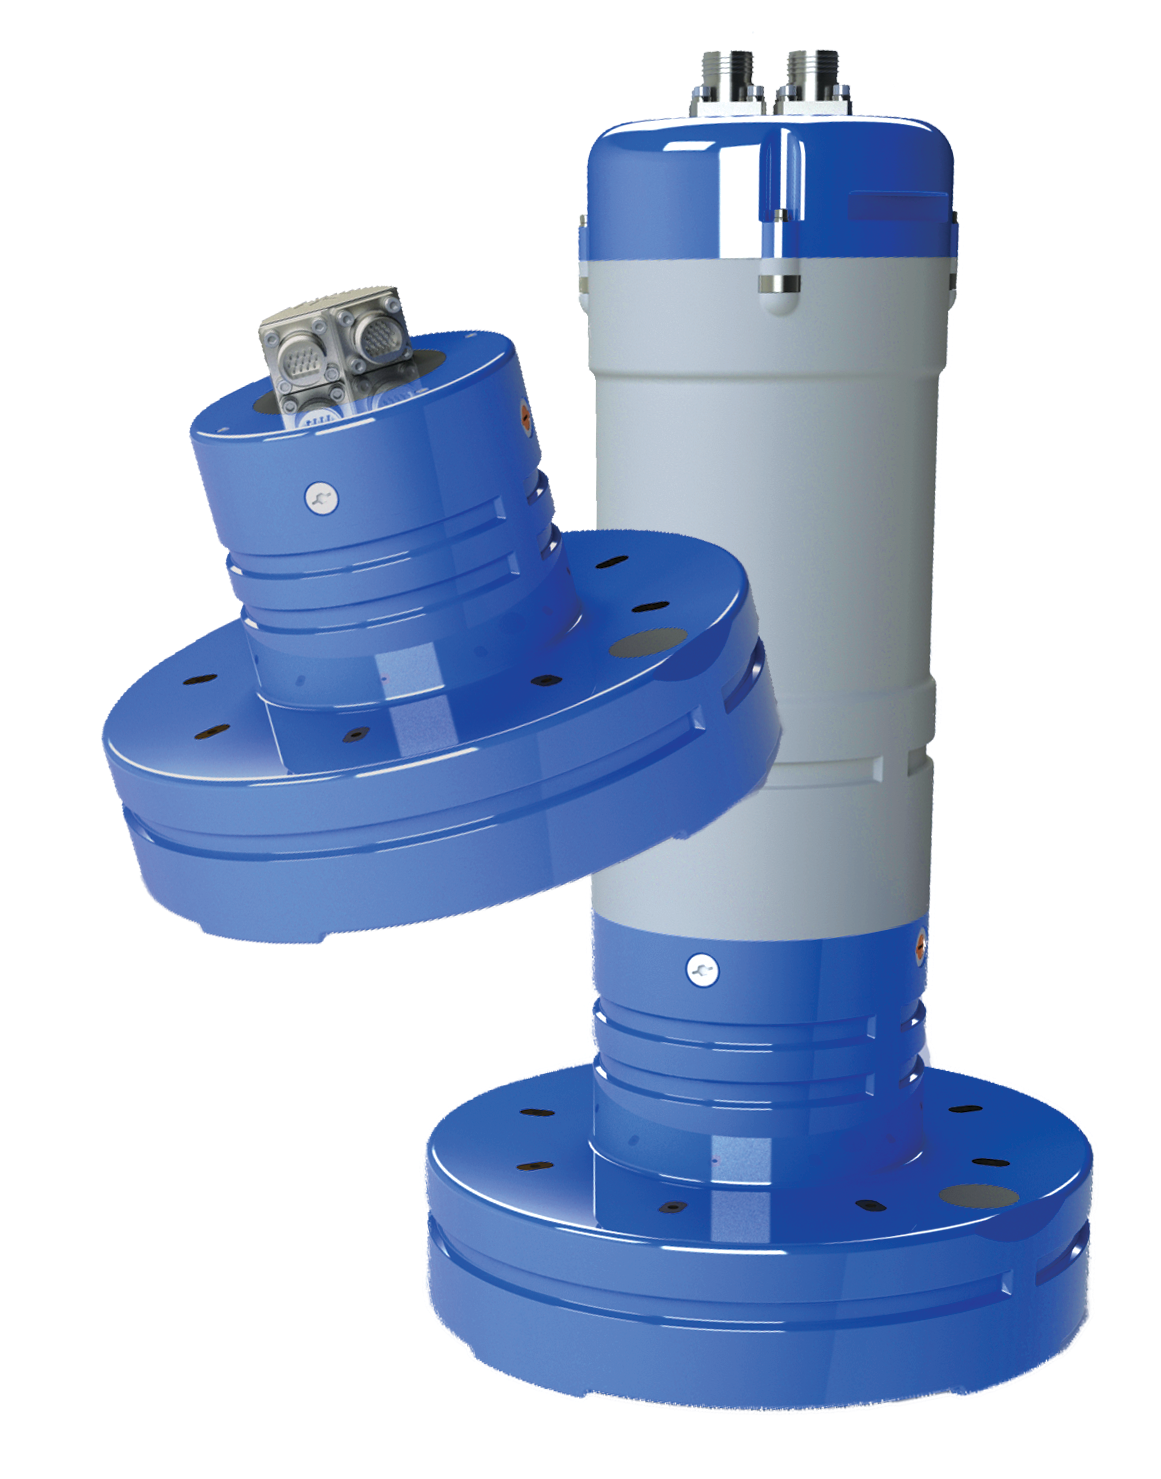
Once again, Teledyne RD Instruments takes its rightful place as the leader in deep-water current profiling technology.  Building upon the tremendous 20-year success of their industry-standard Long Ranger ADCP, Teledyne RDI is pleased to introduce their next-generation long-range ADCP—the Pinnacle 45.

Rated to a depth of 2000 m, the 45 kHz phased array Pinnacle ADCP delivers a 1000 m current profiling range with a decreased size and weight, a game-changing field-swappable configuration, and a long list of impressive new features and product enhancements, including: 

  • Swappable Configuration: Convert from Self-Contained to Real-Time without an additional purchase 
  • Adaptable: Independent or Interlaced long range and high resolution modes allow users to optimize their system for unique deployment requirements, offering the best of both worlds in a single instrument. 
  • Continuous Sampling: Pinnacle’s 4 beams ping simultaneously (as opposed to individually), allowing for simultaneous sampling of a full profile.
  • Easy Data Access: Redundant MicroSD memory cards for added data security.
  • Compass Enhancements: Pinnacle includes both heading field calibration and magnetometer data, allowing you to utilize either or both and to turn your mooring faster.
  • Deployment Status Indicator: External LED light ensures you know the system is operational when deployed. 
  • Advanced Monitoring: Health Monitoring and leak detection provide users with the peace of mind that their system is operating as intended. 
  • Increased Data: 20° phased-array beam allows you to measure within 6% of range to surface (air/sea or bottom), closing the gap on missed data. 
  • Rugged and Robust: Independent main electronics housing and battery compartment and a no metal in contact with the water designed housing and transducer limit the risk of damage from leaks.
  • Long Life: Alkaline or lithium battery compatible, with 18-month deployment durations possible on 4 Li batteries. 

Learn how you can reach your Pinnacle at:  www.teledynemarine.com/Pinnacle
About DeepWater Buoyancy, Inc.

DeepWater Buoyancy creates subsea buoyancy products for leading companies in the oceanographic, seismic, survey, military and offshore oil & gas markets.   Customers have relied on our products for over thirty-five years, from the ocean surface to depths exceeding six thousand meters.

Learn more at www.DeepWaterBuoyancy.com

About Teledyne RD Instruments

With well over 30,000 Doppler products delivered worldwide, Teledyne RD Instruments is the industry’s leading manufacturer of Acoustic Doppler Current Profilers (ADCPs) for current profiling and wave measurement applications; and Doppler Velocity Logs (DVLs) for precision underwater navigation applications. Teledyne RDI also supplies Citadel CTD sensors for a variety of oceanographic applications.

Learn more at www.teledynemarine.com/rdi/

Mooring Matters: Uncertainty in Buoy Drag Coefficients

Mooring Matters: Uncertainty in Buoy Drag Coefficients

For the next installment in our series of technical articles, Ryan Nicoll of Dynamic Systems Analysis, Ltd. (DSA) looks at controlling uncertainty in buoy drag coefficient when designing oceanographic moorings.

Ryan is the Chief Technical Officer of DSA and has vast experience in both software development and use of software in oceanographic mooring design.

How to Control Uncertainty in Buoy Drag Coefficient when Designing Oceanographic Moorings.

By Ryan Nicoll, PEng – CTO of DSA, Ltd.


Introduction

It was the summer of 1991 and I stood in front of the first hedge maze I’d ever seen before. What could be more fun to a young boy that getting lost in a hedge maze and finding your way out?

I had a simple plan: get totally lost as quickly as possible by making random choices. Then I’d take my time to find my way out. So, I ran straight in at full speed, turning left or right at each turn without thinking about it.

Ryan’s first strategy for solving hedge maze: run fast, think later!


The plan completely backfired. By a complete fluke, within a minute or two, I made it to the exit of the maze. I couldn’t believe that I got straight to the end of the maze by making random decisions.

Making random decisions may work once in a while in solving a hedge maze. But you can’t make a random decision for a drag coefficient for an oceanographic buoy. These buoys can be substantial structures. Because they’re substantial, the drag forces on them can also be substantial. If they have even remotely complex shapes, it’s difficult to really know what the drag coefficient is.

We’re going to look at three ways to evaluate oceanographic buoy drag coefficients. These ways increase in complexity but still give you something to start with. These three ways to determine the drag coefficient are using:

  1. Lookup tables
  2. Computational Fluid Dynamics (CFD)
  3. Field deployment data

First, we’re going to cover the use of lookup tables.

Lookup tables are a fantastic starting point

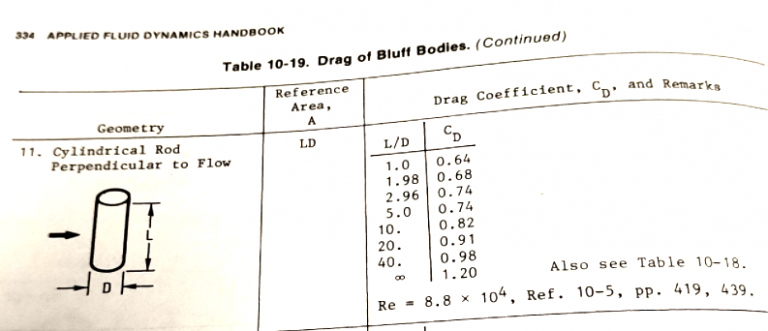
They provide drag coefficients for quite specific shapes and geometries. Helpfully, there are often tables with parameters that help you zero in on your particular shape. For example, a lookup table for a squat cylinder shows a few different values of drag coefficient based on the length to diameter ratio. Lookup tables are easy to use. You find the shape that is closest to what you’re working with, and then that’s the drag coefficient that you use in your calculations.

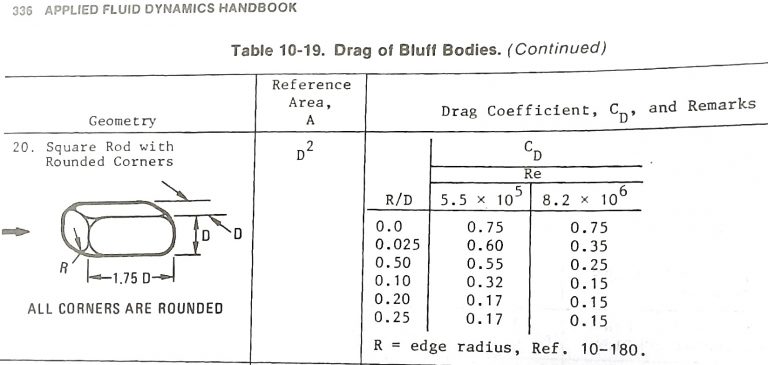
Cylinder drag coefficient lookup table from Applied Fluid Dynamics Handbook by Blevins

Where do these lookup tables come from?

These lookup tables are the results of decades of research and experiments. These experiments measured the total drag force on these shapes in different flow conditions. The resulting drag coefficient is computed from the data and then published in the lookup tables for future reference.

But there are also quite a few limitations

It’s rare to get an exact match to the shape you want. Even with basic shapes like cylinders, your particular form may be out of range of the lookup table. Or you may have only a few examples to work with from the lookup tables you have on hand.

So, while lookup tables give you a starting point, it still leaves some uncertainty. This takes us to the next approach that can be used to resolve the drag coefficient: computational fluid dynamics (CFD).

You can work directly with your specific buoy geometry

Previously, we learned that lookup tables were produced by decades of painstaking research and experiments that measured the total drag force on actual structures. CFD software calculates the dynamics of fluids flowing past structures. Essentially, you can use CFD to run your own virtual experiment on your specific structure directly on your computer.

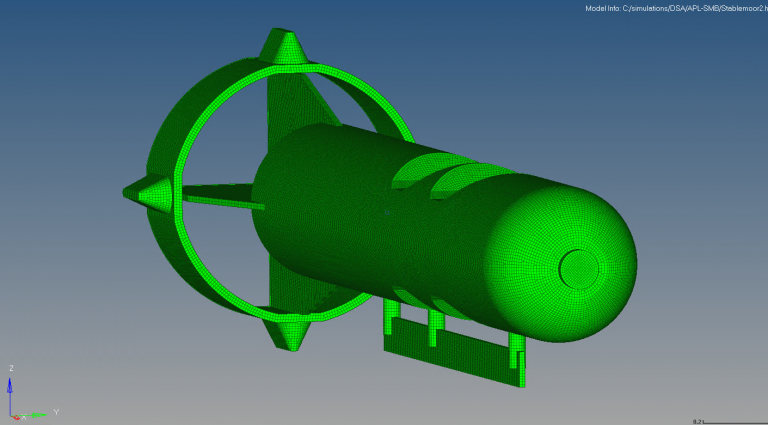
Pre-processing StableMoor® geometry in Altair HyperMesh in preparation for CFD analysis in Altair AcuSolve


Almost any kind of geometry can be used in a CFD tool. Software tools like Altair HyperMesh make it easy to work with 3D models generated from CAD software. This software prepares the geometry for use in a CFD program like Altair AcuSolve. Regardless of the CFD program used, once the geometry is in place, you can set the water flow conditions you want to check. Then, when you run the program, it calculates the corresponding drag coefficient for that geometry in those conditions. This is a significant improvement from lookup tables because you can use much more precise geometry. You aren’t left trying to guess which shape best fits your specific oceanographic buoy.

But there’s a different kind of uncertainty when working with CFD

As incredible as CFD tools are, the dynamics of fluid flows can be incredibly complex. There are also many inputs and settings for the CFD flow physics models. In some particular circumstances, some of these settings can make substantial changes in the output of the drag coefficient calculations. So how do we deal with this new kind of uncertainty? This brings us to the next and final section, validation with field deployment data.

Nothing is more real than reality

If you put an oceanographic buoy in a known water current and you can measure the total drag force, well, you’ve got the actual drag coefficient! Of course, it makes sense that this would eliminate those niggling uncertainties that remain with the previous two methods. We are indeed working with the exact shape, unlike the lookup tables. And we are working with real water flows, unlike an approximation of the water flow as calculated by CFD.

This creates a bit of a chicken and egg problem

We do need to know in advance what the drag coefficient is before we design and deploy the mooring. Otherwise, the mooring is at risk if it deflects far too much, or if it breaks. However, these risks can be controlled with a staged approach using a smaller mooring in lower flow speeds, or even scale model tests in a flow tank. These scale model tests are the kinds of tests done over decades of research to make lookup tables.

What about the cost of a field deployment?

Of course, making a field deployment is incredibly complex and expensive. You need a ship and crew to deploy the equipment. The equipment itself is costly as well. It can be a complicated job to just measure the flow at a site, never mind also some characteristic of the mooring response. But that only shows how unique and valuable the knowledge of the specific drag coefficient is for that particular structure. And that drag coefficient can be used again for new mooring designs and for different locations with different flow speeds in the future.

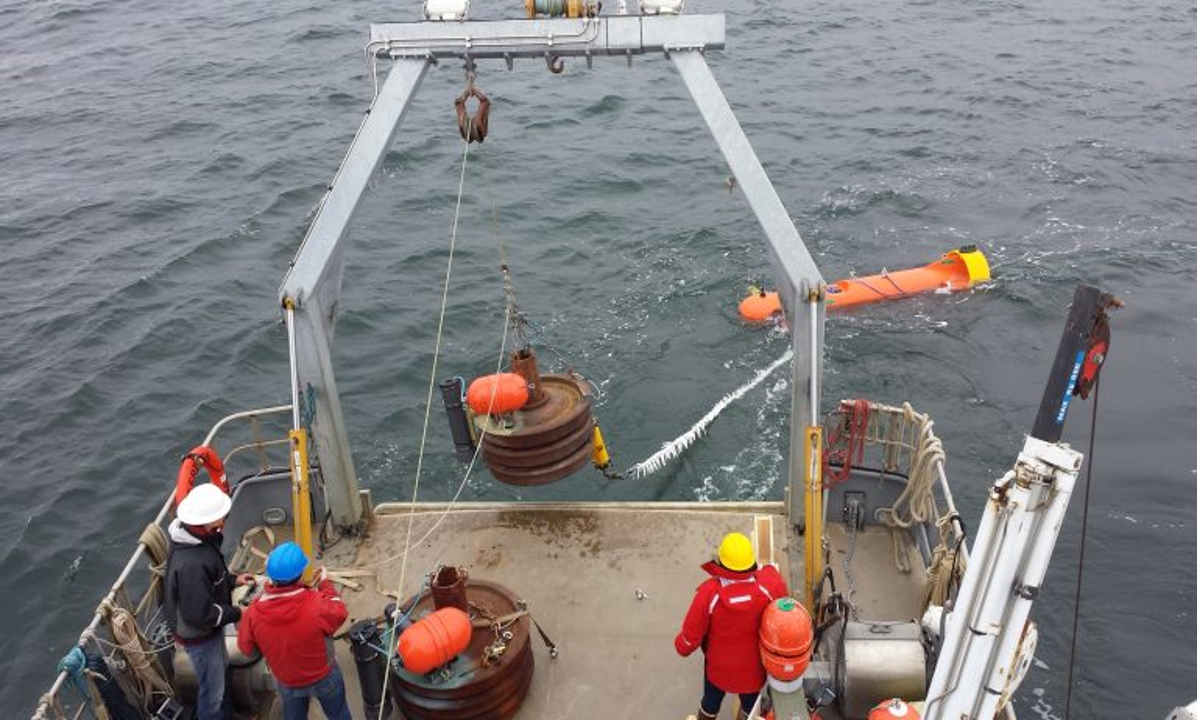
StableMoor deployment for turbulence measurement by APL

Let’s look at a specific example

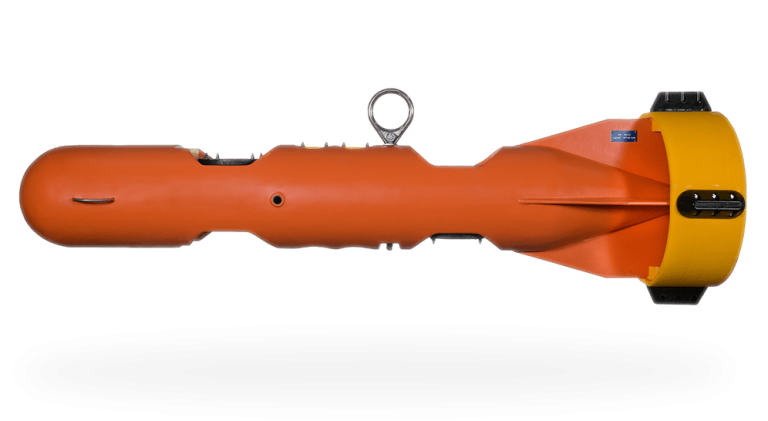
DeepWater Buoyancy’s StableMoor® Buoy is a streamlined float designed to work in high flow conditions. It’s a fairly specific shape. When reviewing lookup tables, there are a few examples that are pretty close, but not exact. Is it more like a rounded rectangle, or cylinder? How can the tail ring be accounted for? There’s only so much we can answer using this approach. The rounded block has a range of 0.25 and 0.55, so we could try 0.55. It may seem a bit random, but that’s the best we can do at this stage. The next stage is using a CFD software tool.

Lookup table drag coefficient values for rounded block from the Applied Fluid Dynamics Handbook by Blevins

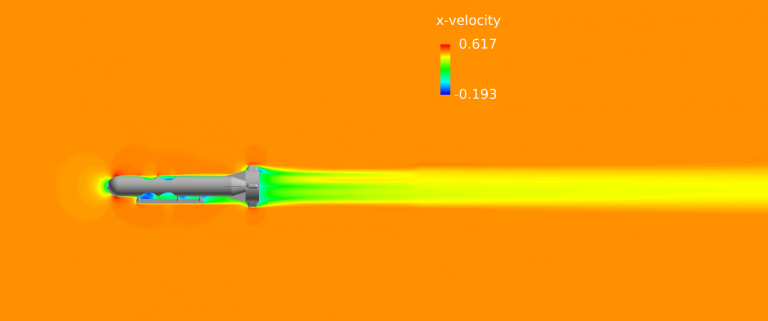
We used the CFD program Altair AcuSolve to compute the drag forces on the actual geometry of a StableMoor Buoy in a few flow speed conditions. Based on the projected area from the main hull, the CFD calculated drag coefficient is 1.0. This is higher than the rounded block lookup table values because the tail ring adds extra drag to the system. At this stage we have a good idea of the buoy drag coefficient to use. To improve on this, the final stage is a validation using field data.

Altair AcuSolve CFD calculations show the flow structure surrounding the StableMoor® Buoy

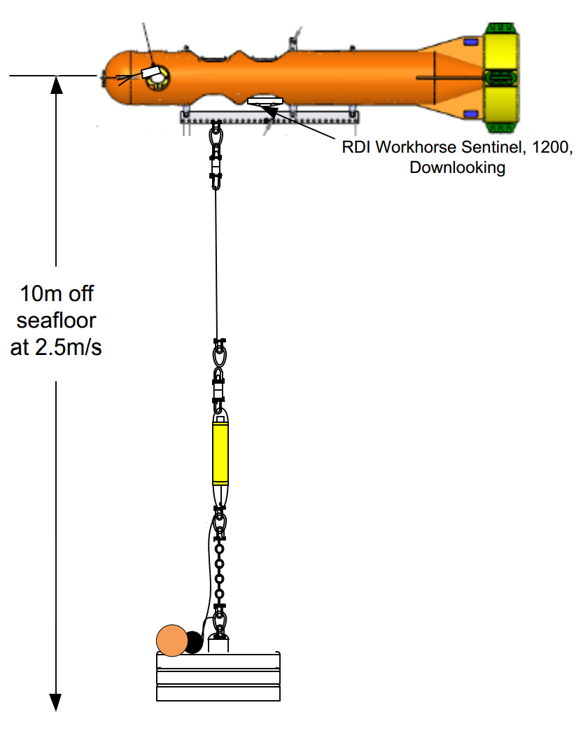
Oceanographers at the UW Applied Physics Laboratory deployed a short mooring with a StableMoor Buoy® in a high flow tidal channel. The onboard sensors measured the flow velocity as well as the altitude of the StableMoor® Buoy off the seabed. As the total drag forces on the mooring and StableMoor® Buoy deflect the system, the altitude of the StableMoor® Buoy decreases. This reduction in altitude is often called knockdown.

APL mooring schematic with StableMoor® Buoy.

We reconstructed the mooring in ProteusDS to compare the results to the measured the knockdown. Using a drag coefficient of 1.0 for the StableMoor® Buoy showed knockdown within the measured range of values from the field deployment: at about 2m/s flow speed, the system shows about a 1m knockdown. So this looks like the CFD software tool did a pretty good job. This builds confidence to use the drag coefficient and the CFD analysis process again for other mooring designs.

We covered a lot of ground in our search for ways to find a drag coefficient

Now it’s time for a quick review. A starting point to resolve a drag coefficient is to use lookup tables. These represent decades of work from real experiments on various shapes. But often there’s not an exact fit to the oceanographic buoy geometry you’re working with.

The next step is to try using a CFD software tool. These software tools can use the specific buoy geometry you’re working with and provide you with the drag coefficient. While these software tools are powerful, they are still an approximation to potentially very complex fluid physics.

Indeed, there’s no replacement for reality, and so the final step would be some kind of real measurement of the buoy in actual flow conditions. While this can be a massive effort, it does provide a valuable validation of the drag coefficient for a particular buoy that can be used again in similar conditions.

Working with drag coefficients may make you feel like you are running around in a maze

You can’t just pick a drag coefficient randomly, rush on to the next step in the mooring design process, and expect success. You may be doing this if you have only a limited lookup table to work with.

Next step

Request a demo license for ProteusDS and explore how the knockdown of your specific mooring configuration can change with different drag coefficients. Use the parts library to get a good starting point in evaluating oceanographic mooring knockdown quickly.

Thanks to APL and DeepWater Buoyancy

Thanks to Jim Thomson and Alex de Klerk from APL and David Capotosto and Dan Cote from DeepWater Buoyancy for sharing technical pointers and information on the mooring deployment and StableMoor® Buoy.

About DeepWater Buoyancy, Inc.

DeepWater Buoyancy creates subsea buoyancy products for leading companies in the oceanographic, seismic, survey, military and offshore oil & gas markets.   Customers have relied on our products for over thirty-five years, from the ocean surface to depths exceeding six thousand meters.

Learn more at www.DeepWaterBuoyancy.com

About Dynamic Systems Analysis Ltd.

Dynamic Systems Analysis Ltd. is an ocean engineering consultancy and software company based in Canada. DSA provides progressive and accessible dynamic analysis expertise and software to enable those working with vessels, structures, lines and technologies in harsh marine environments to reduce risk. DSA provides software and services to the aquaculture & fisheries, defence, marine renewable energy, naval architecture, ocean technology, and offshore sectors.

Learn more at www.dsa-ltd.ca

Mooring Matters: Sustained Measurements of Crucial Ocean Currents – PART 2

Mooring Matters: Sustained Measurements of Crucial Ocean Currents – PART 2

For the next installment in our series of technical articles, Dr. Peter Spain of Teledyne RD Instruments discusses the development of ADCP technology and the use of syntactic foam buoyancy in subsea moorings for sustained measurements of ocean currents.

In Part 2 of this article Dr. Spain presents examples of moored ADCP arrays from around the world.

If you missed Part 1, find it HERE.

Sustained Measurements of Crucial Ocean Currents – PART 2

Moored ADCP Arrays Around the Globe

By Peter Spain Ph.D., Teledyne RD Instruments

Moored ADCP Array: Mozambique Channel

Located off the east coast of southern Africa, the Agulhas Current is one of the world’s major currents. It exerts diverse influences, ranging from marine transport and local biodiversity to earth’s climate system.

Different parts of the Greater Agulhas System exhibit complex circulation patterns that can change substantially from year-to-year. To understand and assess causes for this variability, scientists began studying currents that feed the Agulhas.

In 2003, the Dutch research organization NIOZ and its partners began Long-term Ocean Climate Observations (LOCO). This effort included a long-term observational program off the east coast of Africa at 17°S.

The researchers installed an extensive array of tall moorings across the narrowest part of the Mozambique Channel. The LOCO project redeployed the mooring array several times. The full array was sustained for seven years and a reduced array even longer.

During LOCO, the upper 500 m contained the strongest currents. During several settings of the array, many moorings were topped with upward 75 kHz ADCPs from Teledyne RDI.

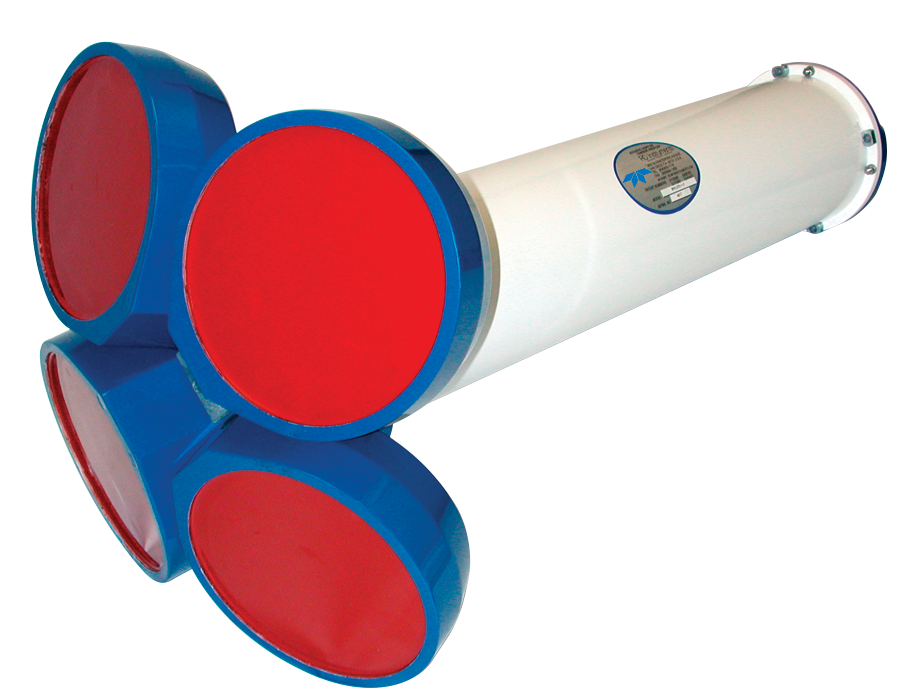
Figure 1 – Teledyne RDI’s Long Ranger 75 kHz ADCP.

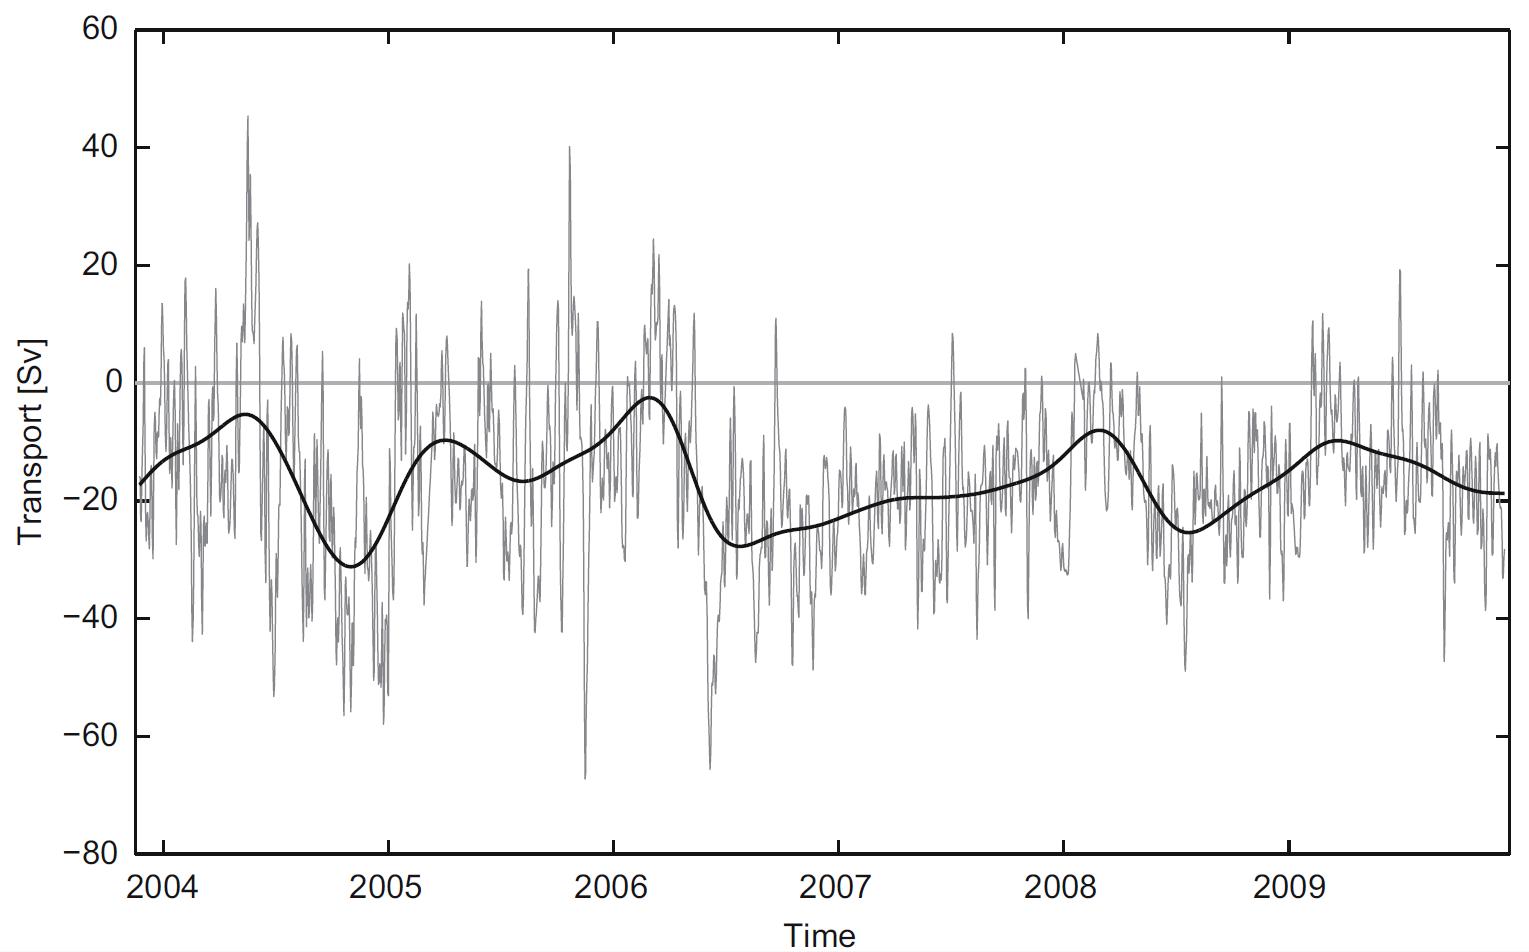
Figure 2 –  Six-year record of volume transport through the Mozambique Channel—from moored ADCP velocity data.
Credit: J. Ullgren et al. (NIOZ) 2012. LINK

The design of these LOCO moorings built on experience at this site. An initial 12-month mooring campaign had recorded currents much stronger than expected. This led to difficulties with mooring blow-over and instrument loss.

Even so the observations revealed intriguing findings. There was no persistent Mozambique Current; rather, transport through the Channel were due to a regular train of large (300-km diameter) eddies.

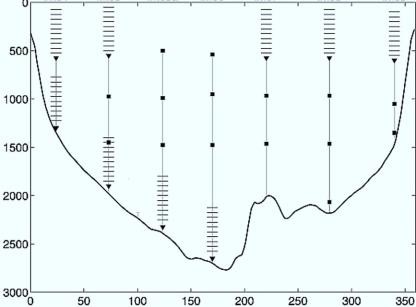
Fig.3. A later setting of LOCO moorings in Mozambique Channel. ADCP profiles are indicated. Scales: depth (m), distance(km).
Adapted from H. Ridderinkhof et al. (NIOZ) 2010. LINK

 The LOCO moorings included many elliptical floats to reduce drag in these strong currents. These changes reduced subsequent blow-over excursions to tens of meters.

The data set spans many years with consistently impressive spatial coverage across the Mozambique Channel.

The Dutch scientists revealed that the pronounced changes in water volume moving through the Mozambique Channel varied at three different time scales. For shorter time scales, large eddies passing southward dominate changes in transport. For seasonal periods, wind-stress patterns over the Indian Ocean basin are influential.

 At interannual time scales, the variation in transport was larger than seasonal. Although large-scale climate fluctuations were identified to be the cause, the response in the Mozambique Channel was delayed almost a year.

Exposing these changes over time – and their subtle climate connection – was possible only with the sustained measurements from the moored array. Surface drifters, floats, and gliders are quickly swept away by strong surface currents.

REFERENCES

  1. Ridderinkhof et al. (NIOZ), 2010. LINK
  2. Ullgren et al. (NIOZ), 2012. LINK

Moored ADCP Array: Faroe Bank Channel Overflow

In recent times, the role of the deep ocean in the global climate system has gained wider attention. Cold, dense waters sinking in the Nordic Seas supply the deep circulation of the global ocean.

Using seabed-mounted ADCPs, there has been long-term monitoring of these waters where they move through deep channels in overflow regions, such as Faroe Bank Channel. More recent studies have looked above the seabed plume at sites downstream from the Channel. This work uses moored ADCPs.

A key element in achieving this coverage was the use of Teledyne RDI ADCPs mounted in DeepWater/Flotec’s syntactic foam buoys. The ADCP time series helped to describe the variability in eddy action and the dominant periodicity. Also, the ADCP profiles showed the velocity signal reached through the water column.

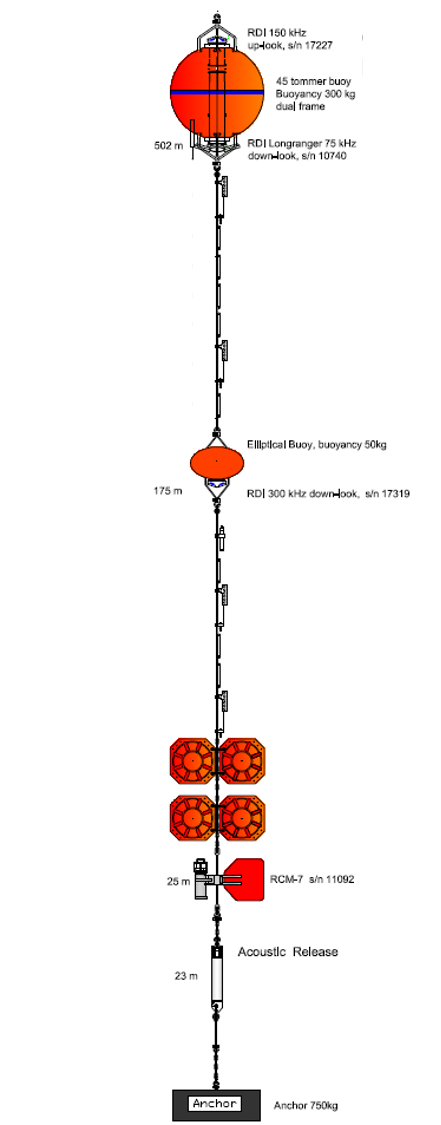
Figure 4 – Mooring Design. Teledyne RDI ADCPs are in top and mid-water buoys supplied by DeepWater/Flotec.
 Credit: I. Fer (Univ. Bergen) 2016. PDF: LINK

Researchers at University of Bergen (Norway) wanted to clarify how the cold, deep plume changes due to entrainment of overlying ambient water. Of interest are the final volume of the plume and how its water properties have been altered before confluence with other deep flows. For these features provide the persistent signature of these waters in the deep global circulation.

Field work used a range of sensors and methods. Researchers wanted to see motions across diverse time and spatial scales. In particular, the researchers used moored ADCPs to span the whole plume. Mooring observations were merged with satellite observations and computer-modeling results.

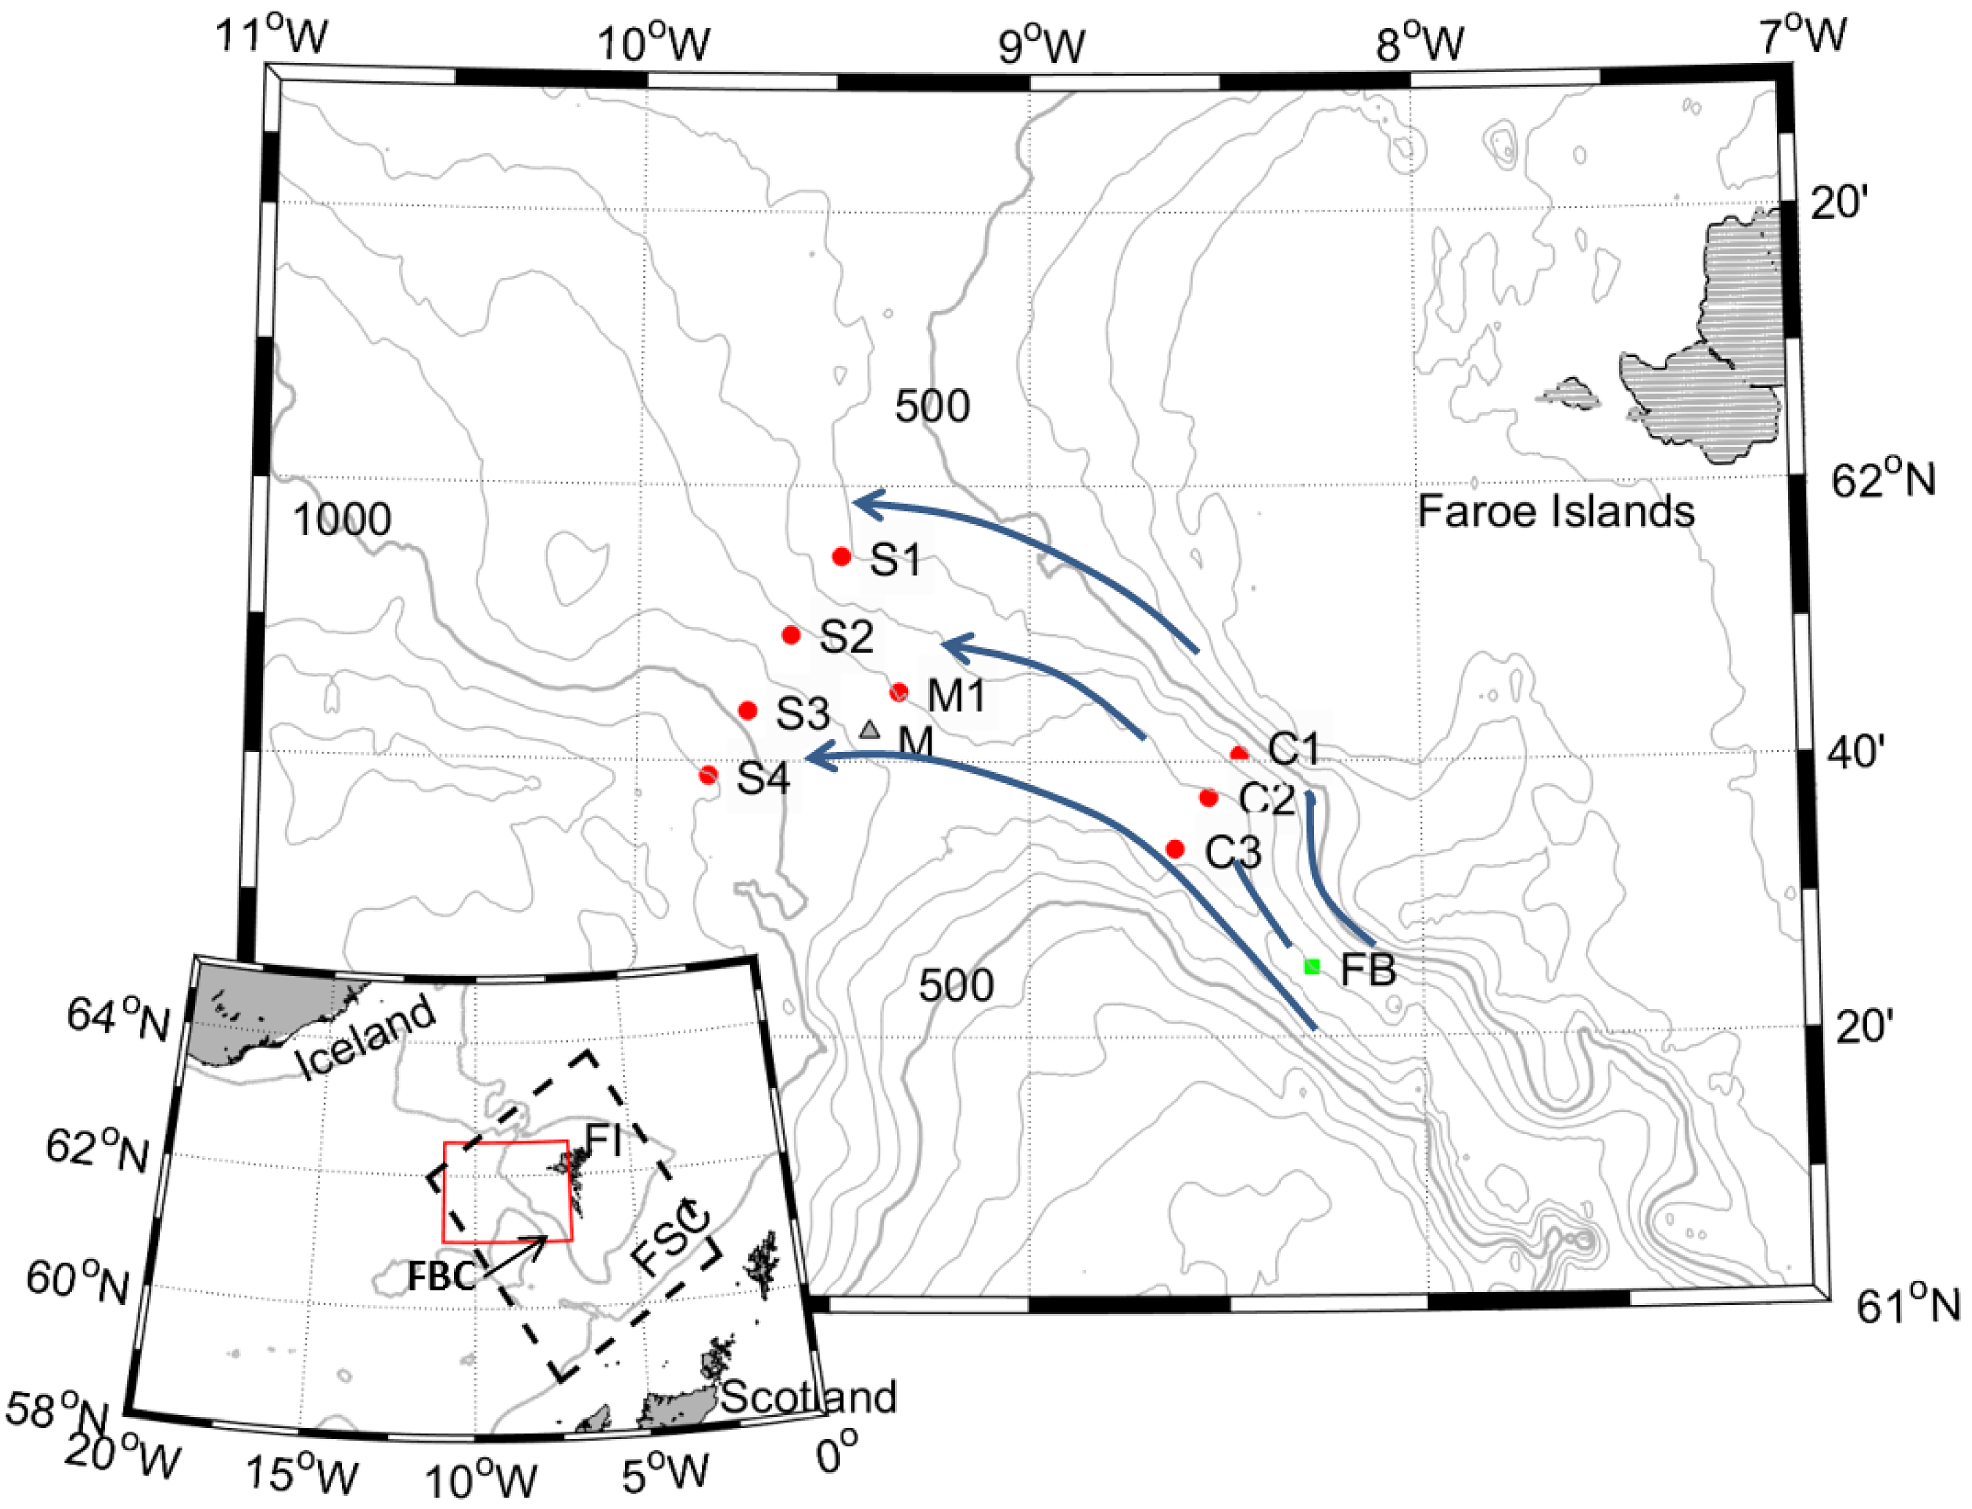
Just downstream of the Faroe Bank Channel, an array of eight moorings measured currents for one year. The moorings were mostly in two lines located in quite different terrain. The first was in a confined channel about 25 km from the main sill. The second was 85 km downstream where the flow is less constrained. Moreover, by that distance, turbulent motions prevail with enhanced mixing through the plume.

The moorings carried Teledyne RDI ADCPs at various frequencies: 75, 150, and 300 kHz. ADCPs closer to the plume were housed in elliptical floats to reduce drag. ADCPs at higher altitude were mounted in spherical floats. Some of the latter carried both up- and down-looking ADCPs.

Figure 5 – Map of mooring array near Faroe Bank Channel. Credit: E. Darelius et al. (Univ. Bergen) 2015. Link

Three 300 kHz ADCPs were dedicated to studying mixing processes. They sat in the core of the plume and profiled its upper interface with high resolution in time and in the vertical.

The currents within the seabed plume are quite strong – almost 1 m/s at the first line. By the second mooring line, the speeds had mostly dropped though the vertical extent of the plume had increased substantially. Of interest was the plume’s high-speed core; it was more confined and had gained speed – due to moving downslope.

To examine blow-over effects on the moorings, the researchers used Richard Dewey’s software for Mooring Design and Dynamics. They constructed time series of the vertical position and tilt of the instruments using measured currents as input. Ground truth was provided by records from pressure sensors.

The researchers wanted to capture the behavior of the whole overflow plume – especially its structure and variability. The farther section had distinct differences, showing strong eddy motions that varied over 3-5 days. Also, the transport of the plume had increased by 30% at that line. The researchers were especially surprised to see how the plume’s volume was altered: not just gaining volume by entraining overlying waters but by losing colder deeper water.

Capturing any changes in the volume and makeup of the cold, dense overflow plumes is demanding. Yet this information is vital for improved understanding of the mechanisms of the deep circulation. For climate studies, sustained measurements from moored ADCP arrays provide a unique time-series view of these deep, narrow, and strong flows.

REFERENCES

I. Fer (Univ. Bergen), 2016. PDF: LINK

E. Darelius et al. (Univ. Bergen), 2015. LINK

Moored ADCP Array: East Australian Current

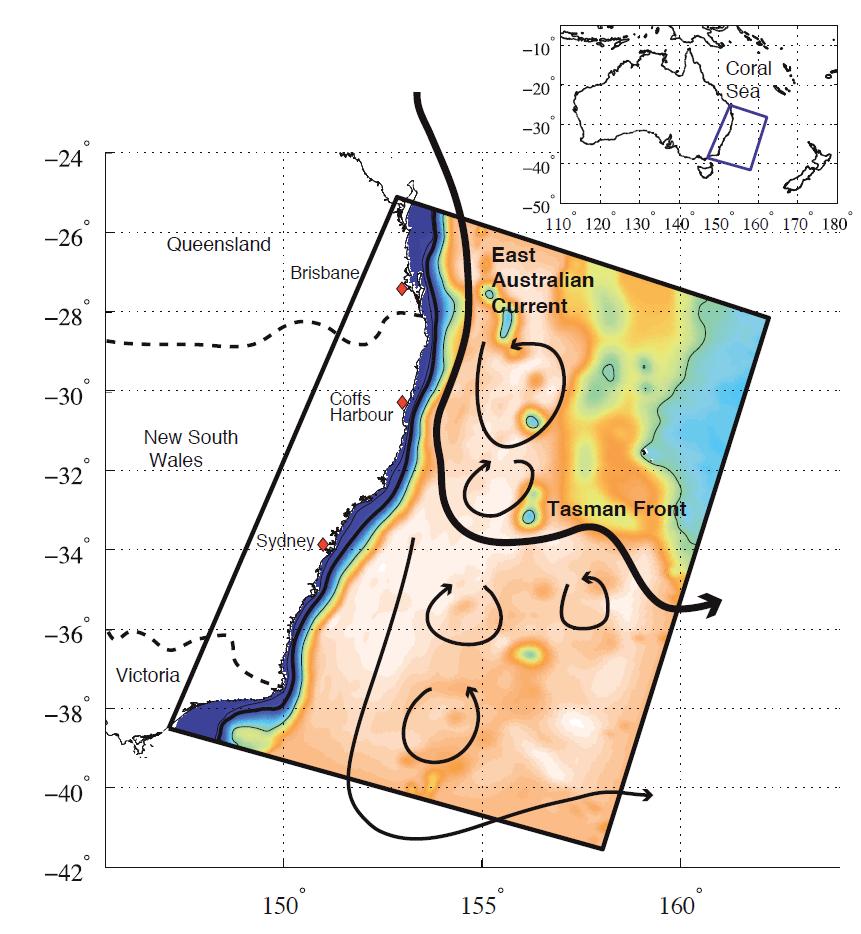
The East Australian Current (EAC) commands the western edge of the South Pacific. Fed by tropical waters, the EAC moves warm water southward for 2500 km along the Australian coast. Its transport is about 20 million cubic meters per second – about 40 times the Amazon River’s discharge.

Near Coffs Harbour on the north coast of New South Wales, much of the EAC turns eastward across the Tasman Sea towards New Zealand. Some residual flow moves farther south, largely as energetic eddies.

Fig.6. East Australian Current System. Credit: C. Kerry et al. (Univ. NSW) 2016. LINK

Seasonal and decadal changes in the southern extent of the warm EAC water have been attributed to altered atmospheric conditions – notably wind patterns. Casualties of changing water properties range from fisheries to kelp forests.

From April 2012, Australian scientists deployed an extensive mooring array across the EAC. This work was part of the Australian Integrated Marine Observing System – IMOS. Installed for 16 months at first, the array has been redeployed. The researchers selected a location at 27°S to discern the typical state of this major boundary current. Farther south, energetic eddies cloud the description.

Fig.7. EAC Moored Array (without M5). Black arrows show ADCP profiling coverage. Colored dots show sensors.
Credit: B. Sloyen et al. (CSIRO) 2016. LINK

Across the continental slope, each mooring carried up- and down-looking ADCPs. They were combined to profile currents to 1000 m depth. Throughout the array, all ADCPs were mounted within DeepWater/Flotec’s spherical buoys of syntactic foam.

The EAC moored array included seven moorings that carried almost 150 instruments. Moorings were heavily instrumented In the upper ocean to measure with high vertical resolution.

Moorings were fitted with many temperature and salinity probes for calculating fluxes of water properties. For measuring the upper ocean, these probes had to be immersed in the strong currents. Some issues with mooring blow-over followed.

Most moorings were over the continental slope where the poleward Current is generally located. Two moorings were located farther offshore in 5000 m depths to capture the width of the EAC system.

Figure 8 – Combining three ADCPs to profile 1000 m in EAC M2 mooring. Credit: IMOS Instrumentation 2015. PDF: LINK

 In fact, large equatorward transport was observed at the offshore edge of the mooring line – 27% of the poleward volume.

Averaged over the deployment, the ADCP measurements showed strong currents in the EAC are limited to the upper 600 m. A subsurface peak at 50-100 m depth provided a bullseye in the flow distribution. On average, poleward currents reached 1500 m; below that depth, currents were slight. For this situation, the volume moving poleward was 22 million cubic meters per second – about 70% of transport through the Florida Straits.

Snapshot views of the moored section showed the distribution of EAC currents to be coherent though very dynamic. At times, the EAC was concentrated over the continental slope whereas at other times it was wider and deeper. When the EAC was more confined, flows at depth could be equatorward across vast expanses. At other times, equatorward flow had disappeared.

Statistical analysis of the flow patterns showed two dominant modes where the EAC was either hugging the continental slope or centered farther offshore. In the latter mode, flows nearer to the shelf headed equatorward. These modes varied with multi-monthly periods that were attributed to remote forcing.

A large fraction of the Australian population lives on the eastern seaboard. The influence of the East Australian Current on their living environment is now more widely appreciated. Yet developing this understanding has been – and remains – challenging.

For scientists to see long-term trends and large-scale connections, moored arrays must collect sustained time series. And for collecting this information, Teledyne RDI ADCPs mounted in DeepWater Buoyancy flotation provide a go-to combination.

REFERENCES

2016 Sloyan, K. Ridgway, and R. Cowley (CSIRO), 2016. LINK

IMOS Instrumentation, 2015. LINK

About DeepWater Buoyancy, Inc.

DeepWater Buoyancy creates subsea buoyancy products for leading companies in the oceanographic, seismic, survey, military and offshore oil & gas markets.   Customers have relied on our products for over thirty-five years, from the ocean surface to depths exceeding six thousand meters.

Learn more at www.DeepWaterBuoyancy.com

About Teledyne RD Instruments

With well over 30,000 Doppler products delivered worldwide, Teledyne RD Instruments is the industry’s leading manufacturer of Acoustic Doppler Current Profilers (ADCPs) for current profiling and wave measurement applications; and Doppler Velocity Logs (DVLs) for precision underwater navigation applications. Teledyne RDI also supplies Citadel CTD sensors for a variety of oceanographic applications.

Learn more at www.teledynemarine.com/rdi/

Product Spotlight – ADCP Buoy Frames

Product Spotlight – ADCP Buoy Frames

DeepWater Buoyancy is the world’s largest producer of subsea buoyancy products for the oceanographic community. At the heart of the product line are the deployment solutions for ADCP applications, including spherical and elliptical buoys, the low-drag StableMoor® buoy, trawl-resistant bottom mounts (TRBMs) and diver serviceable bottom mounts.

This article will spotlight DeepWater Buoyancy’s frame designs for ADCP buoys.

For more information, click HERE.

In the early days of acoustic doppler current profilers (ADCPs) most units on the market were designed with four transducer beams. To most effectively accommodate these four-beam ADCPs, buoys were produced with four tie-rods that pass through the buoy and end frames with four legs that attach to the tie-rods. This design allowed for the beams of the ADCP to pass between the frame legs, unobscured.

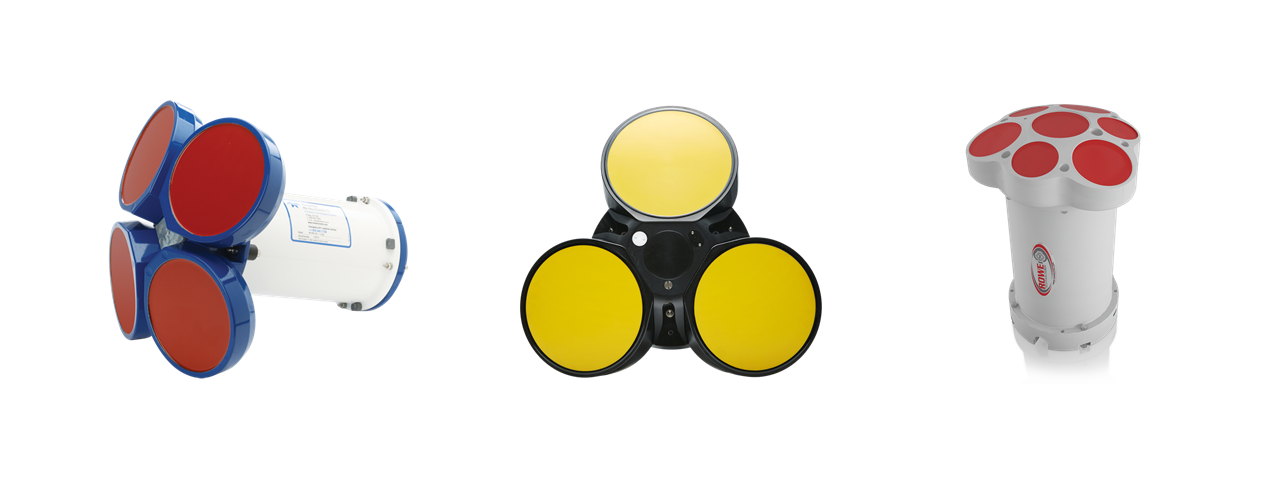
Advances in ADCP technology have since led to ADCPs with as few as three beams and as many as nine transducer beams. In some cases, a center (vertical) beam is included in the configuration. These technological advances in ADCP design have led to changes in the design of the framework for ADCP buoys.

ADCPs with various transducer configurations.

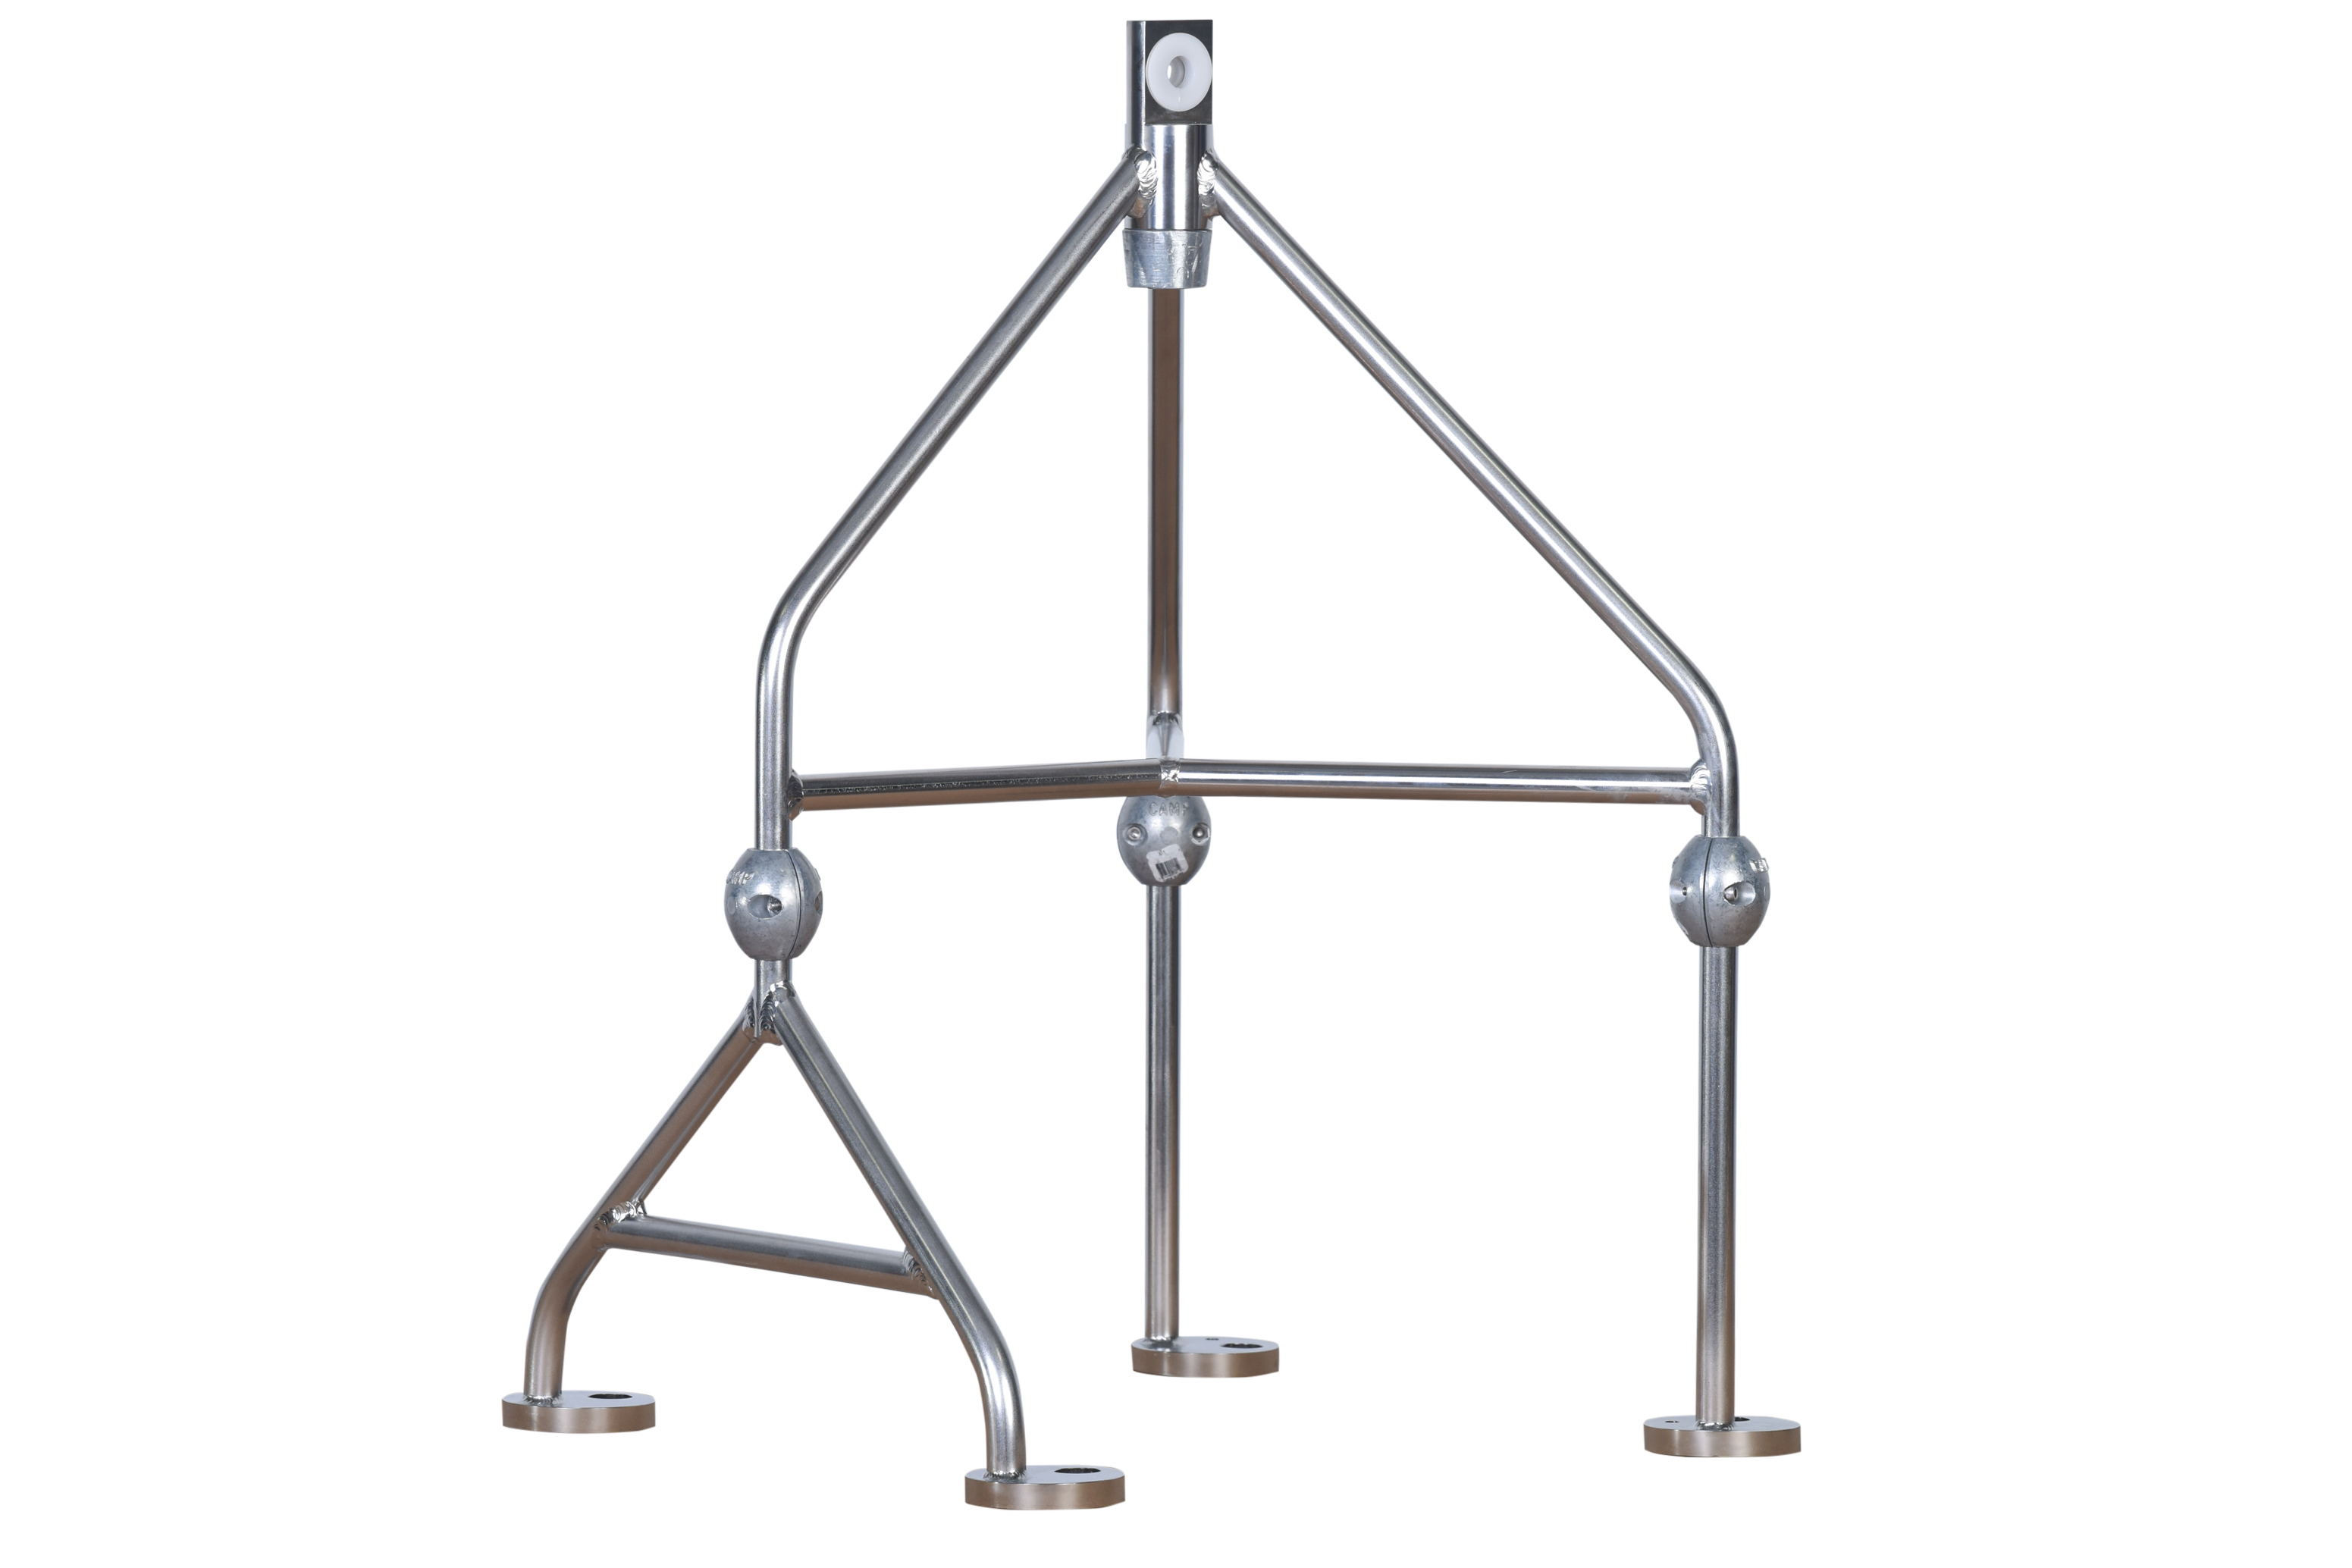
In the case of a three-beam ADCP, buoys are now offered with three tie-rods and end frames with three legs that pass between the beams.  For customers who have previously purchased a buoy outfitted for a four-beam ADCP, but now look to use a three-beam ADCP, a frame is available that mounts on the four tie-rods and transitions to three legs to pass between the beams. Additionally, a buoy can be outfitted with a four-beam frame on one end and a three-beam frame on the other for compatibility with both systems.

ADCP Buoy Top Frame made for a 3 beam ADCP to be mounted in a buoy with four tie-rods.

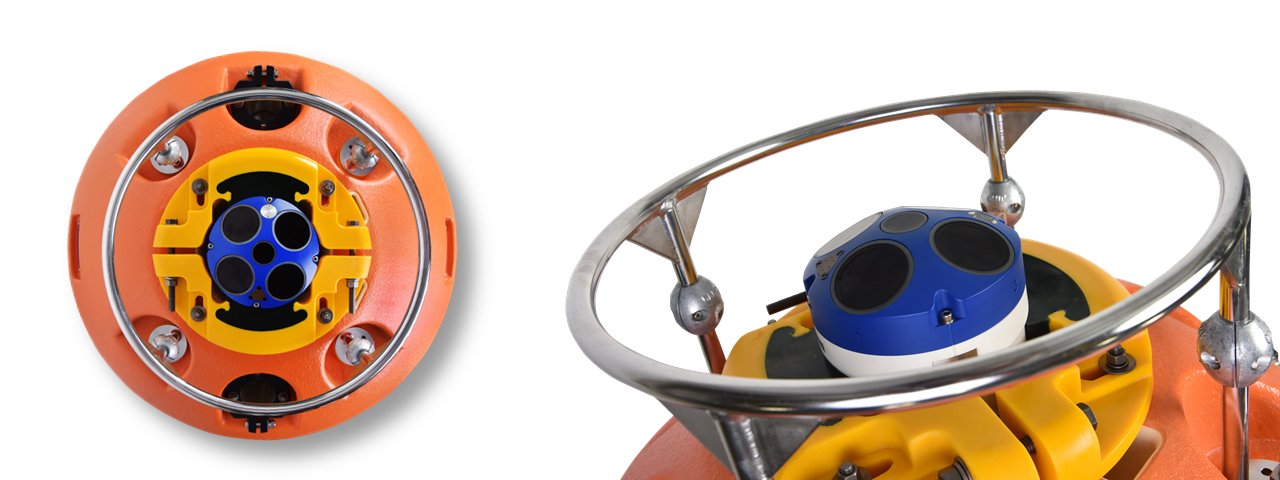
When a buoy is at the top of a mooring and a vertical beam is used, or when an ADCP with several beams is used, typical frames would block the beam or beams. And since the buoy is at the top of the mooring string, the need for a top arbor is eliminated. In this case a ring frame is used.  This frame serves to protect the ADCP head during deployment, recovery, and handling on the deck of a vessel, but will not obstruct the beam pattern.

Ring Frame for ADCP with center vertical beam.


All frames are manufactured with 316L stainless steel. The frames are then electropolished and fitted with replaceable zinc anodes for superior corrosion resistance.  Frames with arbors on them are fitted with isolation bushings and allow connection to the mooring line with standard shackles.

Our extensive in-house design, machining, metalworking, and welding capabilities allow us to make an endless variety of these frames to support and protect not only ADCPs, but also a wide range of other instrumentation. DeepWater Buoyancy’s engineering staff will work with you to design the exact frame that best meets the needs of your equipment, pass through loads, and time at depth.


About DeepWater Buoyancy, Inc.

DeepWater Buoyancy creates subsea buoyancy products for leading companies in the oceanographic, seismic, survey, military and offshore oil & gas markets.   Customers have relied on our products for over thirty-five years, from the ocean surface to depths exceeding six thousand meters.

Learn more at www.DeepWaterBuoyancy.com

Technical Paper: DoE Approach to Mooring Design

Technical Paper: DoE Approach to Mooring Design

DeepWater Buoyancy collaborated with Maine Marine Composites (MMC) on a paper for the Oceans18 Conference. 

The paper, entitled “A Design of Experiments based approach to engineering a robust mooring system for a submerged ADCP”, was presented by Tobias Dewhurst, PhD of MMC.

A copy of the paper can be downloaded HERE.

A copy of the PowerPoint presentation can be downloaded HERE

A Design of Experiments Based Approach to Engineering a Robust Mooring System for a Submerged ADCP


Authors

Michael T. MacNicoll, Tobias Dewhurst, PhD, Richard Akers, P.E. – Maine Marine Composites LLC, Portland, ME, USA

David A. Capotosto, DeepWater Buoyancy, Inc., Biddeford, ME, USA

Summary

A model-based engineering approach was used to design an optimal single-point mooring for a subsea Acoustic Doppler Current Profiler (ADCP). Numerous inputs and criteria were considered. Target deployment depth, environmental conditions, and seafloor characteristics were identified for the selected site in the Gulf of Maine. Design variables included buoy shape, buoy volume, gravity anchor mass, chain size, acoustic release buoyancy, and wire rope diameter. Design criteria included wire rope safety factor, chain load safety factor, ADCP pitch, ADCP knockover (set down), anchor sliding, and the recoverability of the Acoustic Release.  A design methodology based on Design of Experiments (DoE) theory was used to develop a mooring system that satisfied all the competing design objectives while minimizing cost. This methodology limited expensive simulation time while resulting in a satisfactory mooring design.

Keywords—Acoustic Doppler Current Profiler; ADCP; Mooring Design; Design of Experiments

I.    Introduction

A.   Motivation

Numerous competing criteria must be considered when designing mooring systems for oceanographic instruments. These criteria include the deployment depth range, acceptable pitch angles, and cost. Furthermore, environmental conditions and seafloor characteristics must be accounted for properly. An under-designed system could allow excessive instrument motion or movement of the anchor. An overdesigned system increases component costs and requirements for deployment assets. For example, oversizing the mooring line adds weight to the system, which in turn increases the buoyancy requirement. Increasing the buoyancy creates greater stress on the mooring line and increases the anchor weight requirement. These changes drive up the costs. A successful design approach must balance multiple competing criteria without requiring excessive simulation time, while resulting in a mooring system that meets the design criteria under all expected environmental conditions without overdesigning the system.

B.   Methodology

A simulation-based engineering approach was used to design an optimal single-point mooring for a subsea Acoustic Doppler Current Profiler (ADCP). This approach satisfied the objectives above by applying computer simulations in a Design of Experiments (DoE) framework. Using the DoE methodology, an experiment was designed to identify the factors that drive mooring system performance and cost. The results of the experiment were then used to optimize the system based on linear regression of the DoE results. This regression model accounted for both the first-order interactions between factors, and the competing design objectives discussed above.

Simple experiments often attempt to isolate variables and study their effects on a system one at a time. There are two limitations with this approach. First, the number of variables is artificially limited, to limit the time and effort to carry out an experiment. Second, this approach fails to study how design factors might interact with each other. The Design of Experiments (DoE) approach overcomes these shortcomings [1].

DoE is a systematic approach to quantify how sensitive a system is to factors that are believed to influence that system. A DoE setup will require first identifying the factors to be examined. Next, two levels are selected for each factor, and experiments are carried out on the system. This can be done using each possible combination of levels and factors, or a subset of each combination. When the number of factors is large, then the number of all possible combinations of levels and factors can become excessive, so a fractional factorial experiment may be designed that still ensures there is no aliasing between factors and first order interactions between factors.

In the present study, MMC applied a DoE approach to design a mooring system for a submerged ADCP. The DoE approach allowed for efficient examination of a very large design space, identification of the design factors that have the greatest impact on the design objectives, and development of an optimal design.

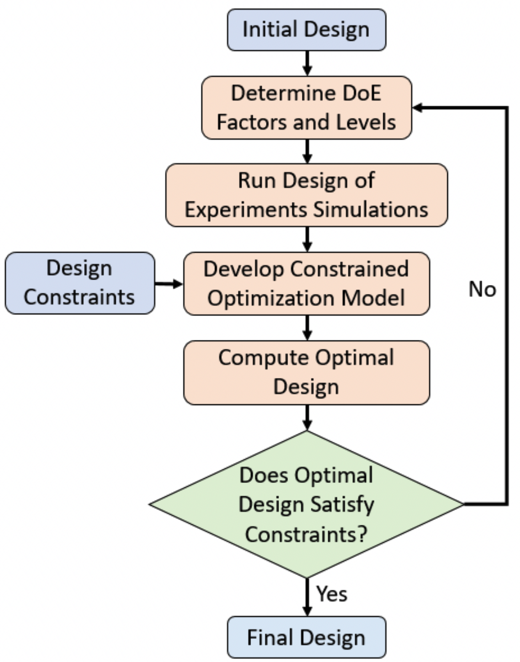
Fig. 1 lays out this design approach. An initial design is proposed, and design constraints are quantified. Design factors are identified. Upper and lower levels are determined for each factor. These levels represent the highest and lowest likely values for each design factor. Next, a DoE experiment is set up and computer simulations are run. The results of the DoE simulations are used to develop a regression model based on the design constraints. If the optimal design does not satisfy the design constraints, a revised DoE is developed. The revised DoE will require adjusting the levels of the factors, or adding new factors, to improve the results. The process is repeated until the optimal design converges on one which satisfies the constrained design objectives.

Figure 1. Flowchart of Design Approach

II.    Procedure

A.   Mooring System Initial Design

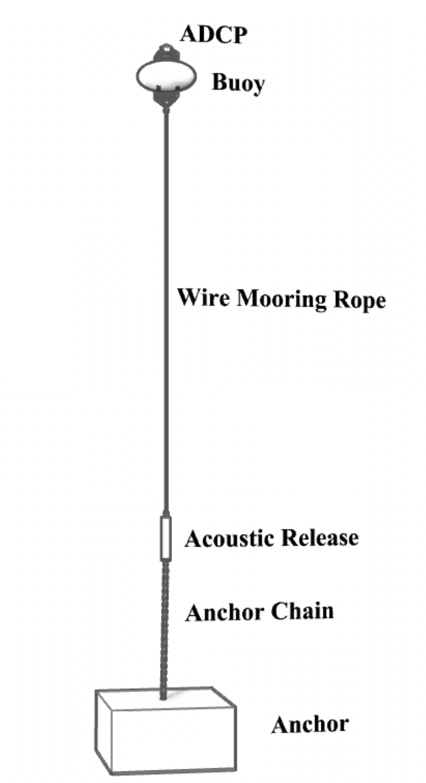
The ADCP mooring equipment was based on a typical mooring system design (see [2] for example) The arrangement consists of an anchor, connected with chain to an acoustic release (used to retrieve the ADCP) with some added buoyancy, and a wire rope from the acoustic release to a buoy that keeps the ADCP in position. The ADCP is attached to the top of the buoy and is positioned 100 meters below the surface to avoid the most extreme wave motions. The buoy has the dual objectives of (1) providing reserve buoyancy to keep the ADCP upright and in position to minimize pitching and knockover (set down) motions, and (2) to bring the mooring string to the surface when the release is activated. The arrangement is shown in Fig. 2.

Figure 2 Components of moored ADCP. Chain and wire rope lengths are not to scale.

B.   Environmental Conditions

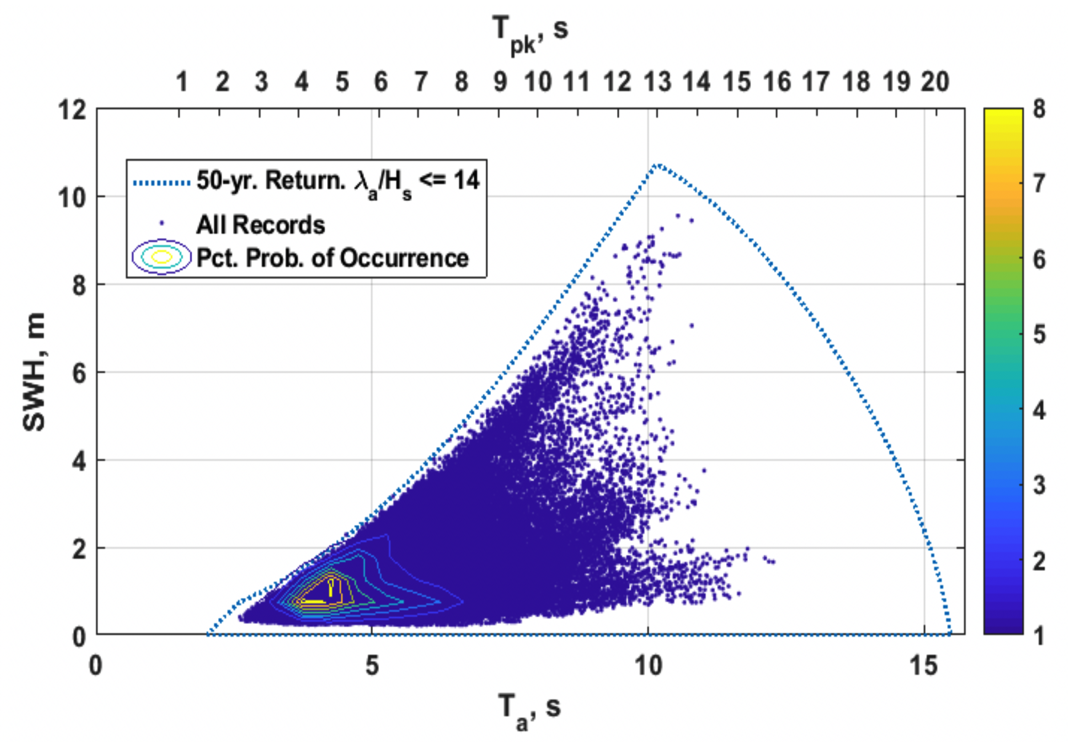
The ADCP will be deployed near the National Oceanic and Atmospheric Administration’s (NOAA) National Data Buoy Center (NDBC) Station 44098, Jeffrey’s Ledge in 300 meters of water [3]. A robust metocean study of the deployment location was performed by MMC using historical wave data from NDBC for the years 2008-2015. This study used Principle Component Analysis and the inverse first-order reliability method (I-FORM), as described in [4] and as implemented in the Wave-Energy-Converter Design Response Toolkit [5]. In this approach, linear algebraic methods are used to develop an orthogonal basis whose components are aligned so as to represent the largest degree of variance.  Once these principal components are identified, extreme contours are generated using the I-FORM approach [6]. The extreme contour was limited to the steepness at which waves generally break. The resulting 50-year return period contour is shown in Fig. 3. From this analysis, the largest 50-year return period significant wave height is 10.7 m, with a peak period of 13 s.

Figure 3  50-year sea state contour at Jeffrey’s Ledge, NH (solid blue line). Blue dots are historical observations. Contour lines show probabilities of occurrence.


C.   Design Constraints

As the goal of this study was to use a DoE-based approach to design a robust and cost-effective mooring system, the following seven design objectives were identified:

  • Prevent uplift and sliding of the anchor
  • Minimize knockover of the ADCP
  • Minimize pitch of the ADCP
  • Maintain minimum safety factor of the wire rope of at least 1.67 [7]
  • Maintain minimum safety factor of the anchor chain of at least 1.67 [7]
  • Acoustic release must have enough buoyancy to be recoverable if the wire rope fails and the acoustic release is disconnected from the upper buoy.
  • Minimize the cost of the system

D.   Design Factors

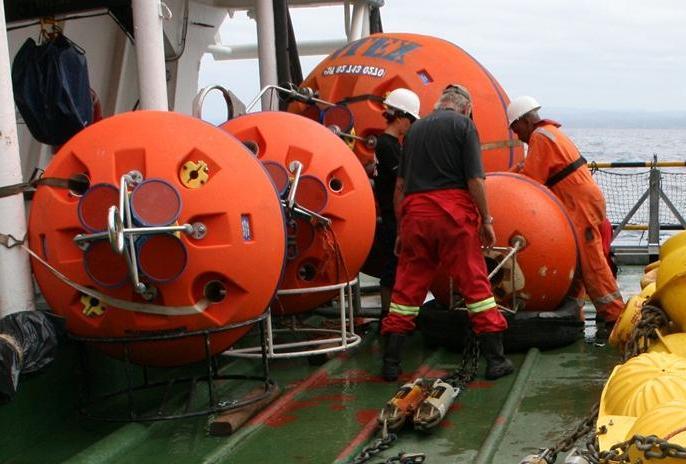
Six design factors were identified. These are the variables of the mooring arrangement that will be tuned by the DoE simulations. Two factors related to the ADCP buoy. Two buoy shapes, a spherical buoy and an elliptical buoy, were simulated. These are based on ADCP buoys made by DeepWater Buoyancy Inc., shown in Fig. 4. In addition, two buoy volumes (and corresponding buoyancy lift forces) were simulated for each shape. The buoy has the primary objectives of mitigating ADCP pitching and knockover. Larger buoys will increase the cost of the system and the loads on the mooring lines, while smaller buoys will be less effective in mitigating ADCP motions.

The third design factor is the mass of the anchor. The anchor must be heavy enough that it does not move, either vertically or laterally. However larger anchors will increase the cost of the system.

The diameter of the chain and wire rope components of the mooring line are the next two factors. The primary trade-off for these components is safety factor vs. cost. Smaller components will have lower safety factors, but larger components will drive up the cost of the system.

The final factor is the buoyancy of the acoustic release. This must provide enough uplift to ensure that the acoustic release can be recovered if the wire rope fails and the acoustic release is separated from the reserve buoyancy.

These design factors, and the corresponding higher and lower levels, are summarized in TABLE I. In a full factorial DoE, every combination of high and low levels for each factor would be simulated, resulting in 27=128 simulations. In this work a fractional factorial matrix was design with resolution four, which ensured that all primary factor and first order interaction effects could be isolated without aliasing, while reducing the number of required simulations [8].

Figure 4  ADCP buoyancy options. Top: spherical buoy; bottom: elliptical buoy (source: www.deepwaterbuoyancy.com).


Table 1  Summary of DoE Input Factors


E.   Computer Simulation

A computer simulation of the ADCP and its mooring system was developed using the commercial software OrcaFlex by Orcina [9]. Simulations were run for each row of the fractional factorial matrix during the 50-year return period storm with a steady current.

Three phases of ADCP deployment were investigated in the DoE simulations, including (1) deployment in calm water, (2) survival in 50-year return period storm event, and (3) retrieval using the acoustic release. Deployment involved releasing the ADCP from the surface and allowing the entire system to sink until the anchor reached the seabed. The retrieval was simulated by disconnecting the reserve buoyancy buoy from the wire rope, and the acoustic release from the chain. The acoustic release, provided it was buoyant enough, would rise to the surface with the wire rope.

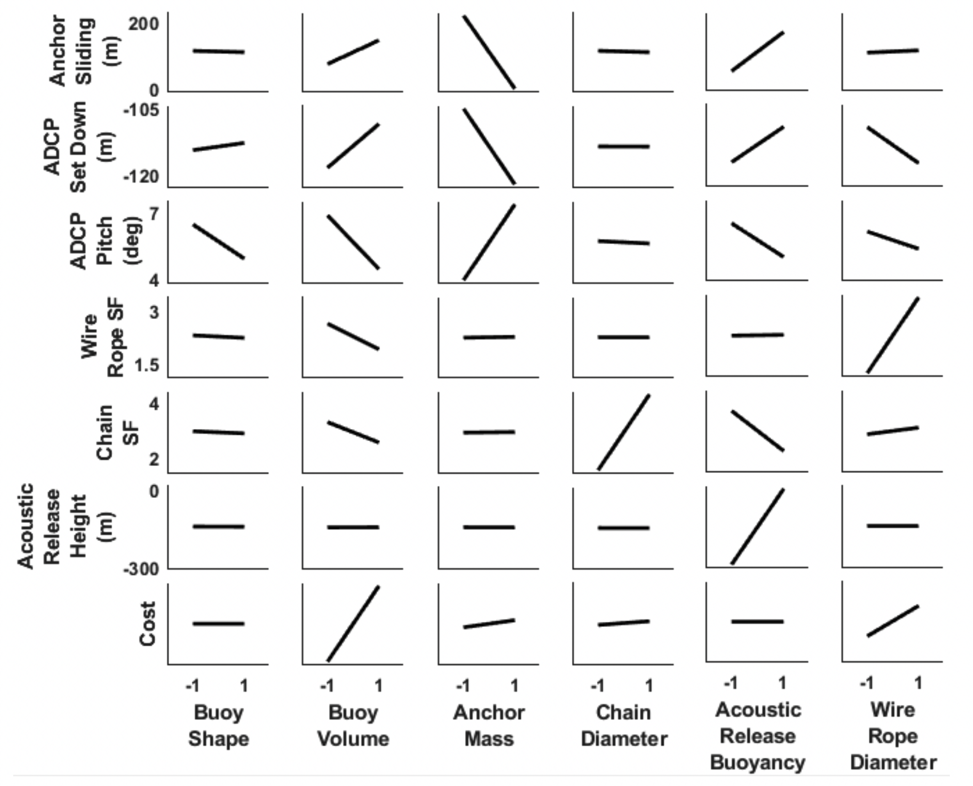
The results of the DoE simulations are shown in Main Effects plots in Fig. 5. Each subplot shows the sensitivity of a single factor to the corresponding design objective. The steeper the line, the more sensitive the objective is to that factor. Some of the design trade-offs that must be considered are shown clearly in this figure. For example, increasing the buoy volume has the beneficial effects of decreasing the ADCP pitching and set down. However, there are also negative consequences to increasing the buoy volume, such as increasing the mooring loads, increasing the likelihood of anchor sliding, and increasing the cost of the system. To weight the pros and cons of conflicting design objectives, a global objective function was developed. This is discussed in the following section.

Figure 5  Summary of Design of Experiments simulation results. Each row shows the Main Effects plots for every factor and a single objective. Each column shows the Main Effects plots for every objective for a single factor.


F.   Optimization Results

The results of the DoE simulations were used to optimize the ADCP mooring system design. For each of the design objectives discussed above, a linear regression model was computed. For objective i, this takes the form:

(1)

Here bi are the regression coefficients and X are the levels for each factor, including first-order interactions and a constant intercept.

There are several limitations with using a strictly linear regression model to optimize the mooring design. First, there is no convenient way look at multiple design objectives at the same time. Second, many objectives are not linear. For example, the safety factor of the mooring rope must be at least 1.67, however, once it is over that threshold, it is less critical that it continue to be improved. To account for these limitations, each design objective was normalized with a logistic function,

(2)

Here fi(X) is the regression function for objective, i, and ki and x0,i are steepness and midpoint parameters which must be identified. The global objective function is then taken as the minimum of each objective:

 (3)

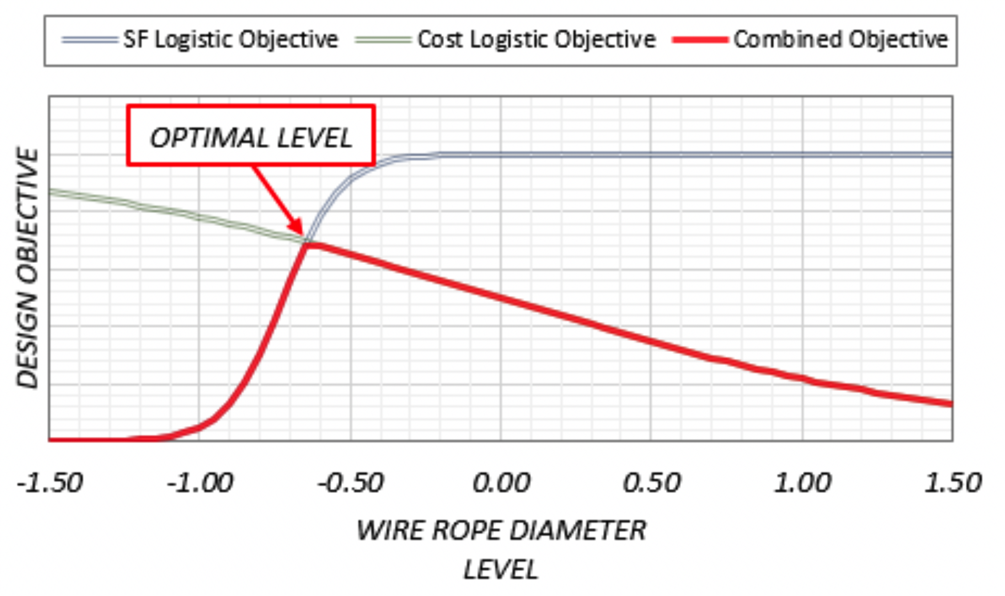
This is illustrated in Fig. 6. The wire rope safety factor experiences a steep drop-off when the safety factor approaches the design target. Above the target, the safety factor is not as sensitive to changes in the wire rope diameter. The cost objective function does not experience a steep drop-off, as there is no hard target. The optimal wire rope diameter is the peak of the Combined Objective function, which is located at the intersection of the two sub-objectives.

Figure 6  Illustration of wire rope safety factor and cost objectives as a function of wire rope level. The combined objective function is shown in red.


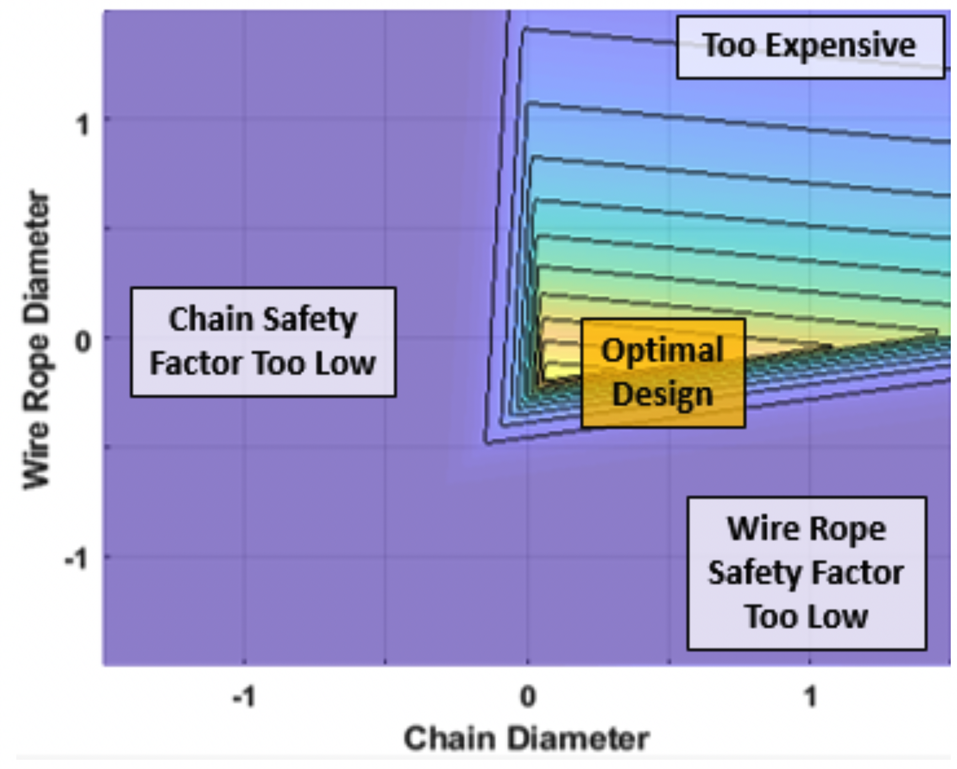
When all six design factors and all seven design objectives are considered, it is not possible to visualize the objective function in two dimensions. Fig. 7, Fig. 8, and Fig. 9 each show the objective function plotted as a surface plot for two factors.

Fig. 7 shows the objective function as a surface plot with respect to the chain diameter and the wire rope diameter. There is a trade-off between safety factor and cost that suggests that the optimal wire rope and chain diameters are roughly halfway between the upper and lower DoE levels.

Figure 7  Objective surface plot shown with respect to chain diameter (x-axis) and wire rope diameter (y-axis). Yellow regions show the peak objective values.


Fig. 8 shows the objective function with respect to the buoy shape and size. The buoyancy must optimized to balance a reduction in cost with an increase in wire rope safety. As the buoyancy decreases, however, the ADCP pitch increases. An elliptical buoy shape better mitigates ADCP pitch than a spherical buoy.

Figure 8  Objective surface plot shown with respect to reserve buoyancy (buoy) shape (x-axis) and buoy volume (y-axis). Yellow regions show the peak objective values.


Fig. 9 shows the objective function with respect to the anchor mass and acoustic release buoyancy. The optimal design occurs when the anchor mass and acoustic release buoyancy are large, but beyond a certain point the design is less optimal as the cost of the system becomes the limiting factor.

Figure 9  Objective surface plot shown with respect to anchor mass (x-axis) and acoustic release buoyancy (y-axis). Yellow regions show the peak objective values.


III.    Results

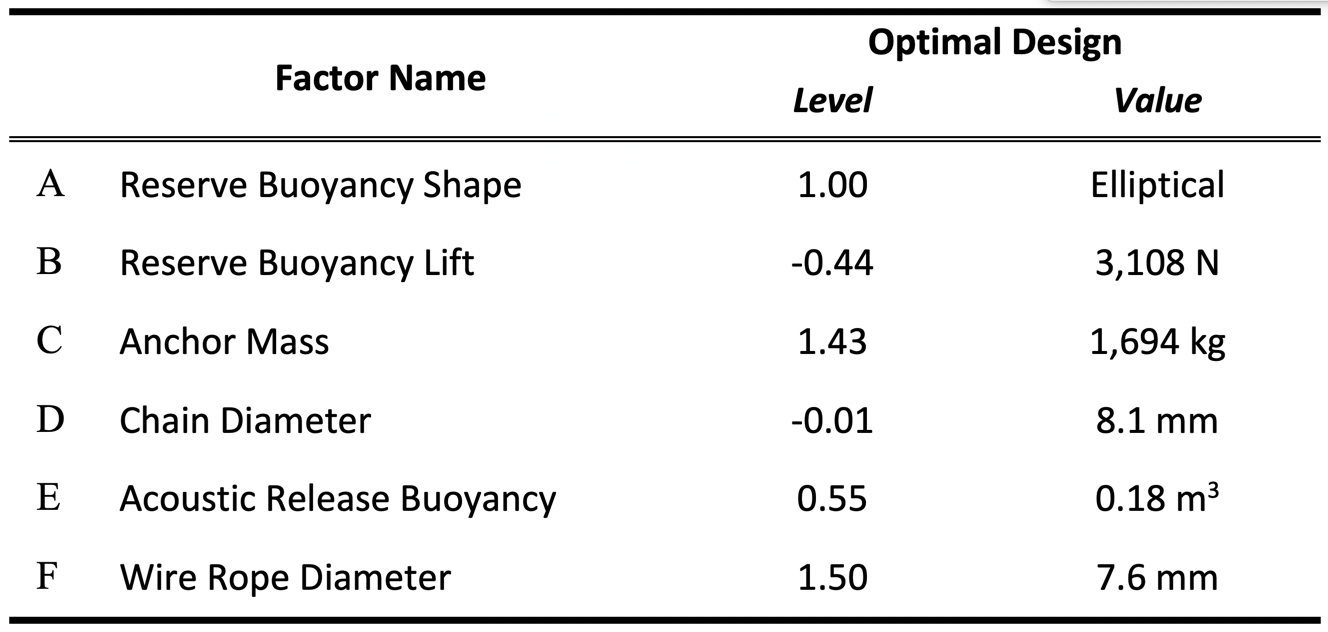
Once the objective function was defined, most standard optimization routines can be used to determine the optimal values. TABLE II. summarizes the optimal levels of each factor.

Table 2  Summary of Optimal Design


The optimal ADCP buoy is an elliptical buoy with a diameter of 50.5 inches. The optimal mooring lines are a 7.6 mm diameter wire rope and an 8.1 mm diameter studless chain. To ensure that sliding on the seabed is minimized, the anchor mass must be 1,694 kg, slightly larger than the highest level simulated. The acoustic release needs an additional 0.185 m^3 of buoyancy to ensure that it will be retrieved if it becomes separated from the buoy.

To validate that the DoE procedure successfully converged on a working arrangement, the design summarized in TABLE II. was simulated for a duration of three hours in the maximum 50-year return period sea state at the Jeffrey’s Ledge site. Extreme Value Analysis was used to find the peak expected value and confidence intervals for each objective. For objectives that are Gaussian, or nearly so, the three-hour extremes were computed according to:

Here x is an arbitrary data field, μx is the simulated mean, T is the dominant wave period, and σx is the simulated standard deviation.
For non-Gaussian distributed objectives, such as the mooring tension, the three-hour extremes were fit to a Generalized Pareto Distribution, using a Peaks-Over-Threshold (POT) approach [10], [11]. Then the upper 95th percentile of the expected values are used.
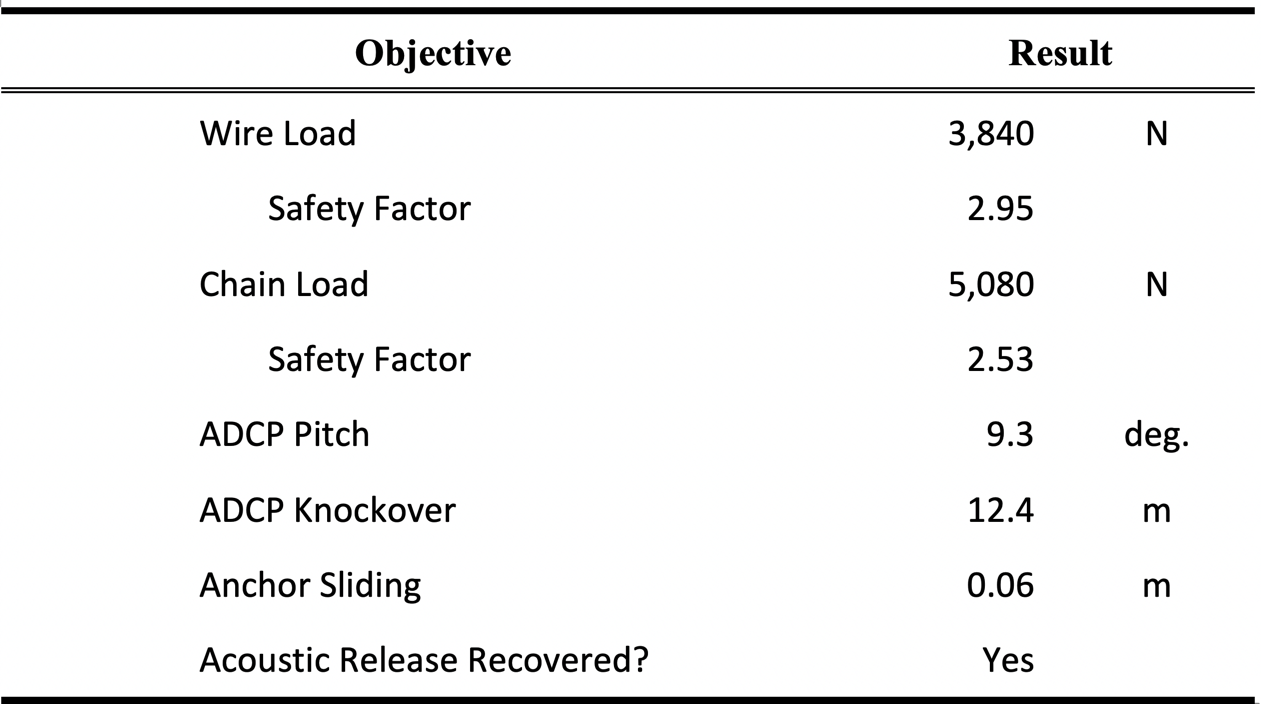
The results are summarized in TABLE III. The wire rope and chain safety factors are acceptable – both well above the target of 1.67 [7]. The pitch angle and knockover are manageable, the anchor stays in place, and the Acoustic Release is successfully recovered.

Table 3  Summary of Optimal Design Results


IV.    Discussion

Maine Marine Composites, in collaboration with DeepWater Buoyancy Inc, applied a Design of Experiments-based simulation approach to developing a robust, cost-effective mooring system for a hypothetical submerged ADCP in the Gulf of Maine. The DoE approach made it possible to quickly examine a broad range of design factors and levels, and the optimal design was shown to meet all the desired objectives.

The objective function used for optimization is based on linear regression of the DoE results. The objective function is constructed in such a way that all objectives are met without needlessly maximizing any objectives beyond their target levels. This approach supports both constraints and objectives, where constraints are a limit the design must achieve (“Ensure that the mooring safety factor is at least 2.2”) and objectives are more open-ended (“Minimize the cost of the mooring system”).

References

  1. Fisher, R., Design of Experiments, 8th, Oliver and Boyd LTD, Edinburgh, 1960.
  2. Ma, B.B., Lien, R-C., and D.S. Ko, “The variability of internal tides in the Northern South China Sea,” J. Oceanogr. 69, 2013, pp. 619-630.
  3. National Oceanic and Atmospheric Administration’s National Data Buoy Center. “Station 44098 – Jeffrey’s Ledge, NH (160).” S. Dept. of Commerce. https://www.ndbc.noaa.gov/station_page.php?station=44098.
  4. Eckert-Gallup, Sallaberry, Dallman, Neary. “Application of principle component anlysis (PCA) and improved joint probability distribution to the inverse first-order reliability method (I-FORM) for predicting extreme sea states,” Ocean Engineerign, 2016, pp. 307-319.
  5. Coe, R.G. Michelen, C., Eckert-Gallup, A., Yu, Y., and J.v. Rij, “WDRT: A toolbox for design-response analysis of wave energy converters,” Proceedings of the 4th Marine Energy Technology Symposium (METS), Washington D.C., 2016.
  6. Haver, S., and S. Winterstein, “Environmental contour lines: a method for estimating long term extremes by short term anslysis,” Trans. Soc. Nav. Archit. Mar. Eng. 116, 2009, pp. 116-127.
  7. American Bureau of Shipping (ABS), Guide for Position Mooring Systems, Houston, TX, 2018.
  8. Krishnaiah, K., and P. Shahabudeen, Applied Design of Experiments and Taguchi Methods, PHI Learning Private Limited, New Dehli, 2012.
  9. Orcina LTC, OrcaFlex User Manual: OrcaFlex Version 10.2c, Daltongate Ulverston Cumbria, UK, 2018.
  10. Bommier, E., “Peaks-Over-Threshold Modelling of Environmental Data,” U.U.D.M. Project Report, 2014:33.
  11. do Nascimento, F.F., Gamerman, D., and H. Freitas Lopes, “A semiparametric Bayesian approach to extreme value estimation,” Stat. Comput. 22, 2012, pp. 661-675.

About DeepWater Buoyancy, Inc.

DeepWater Buoyancy creates subsea buoyancy products for leading companies in the oceanographic, seismic, survey, military and offshore oil & gas markets.   Customers have relied on our products for over thirty-five years, from the ocean surface to depths exceeding six thousand meters.

Learn more at www.DeepWaterBuoyancy.com

About Maine Marine Composites

MMC specializes in motion prediction for ships and platforms, analyses of fluid/structural dynamics, and mooring system design and simulation. Our engineering staff has decades of experience with design and analysis of ships and offshore energy systems, and has successfully completed diverse and challenging projects for many of the most highly regarded offshore and ocean energy companies.

For more information, please contact Richard Akers at dakers@mainemarinecomposites.com

Learn more at www.mainemarinecomposites.com

Mooring Matters: Sustained Measurements of Crucial Ocean Currents – PART 2

Mooring Matters: Sustained Measurements of Crucial Ocean Currents

For the next installment in our series of technical articles, Dr. Peter Spain of Teledyne RD Instruments discusses the development of ADCP technology and the use of syntactic foam buoyancy in subsea moorings for sustained measurements of ocean currents.

Sustained Measurements of Crucial Ocean Currents

Teledyne RDI ADCPs and DeepWater Buoyancy Deliver a Go-To Combo

By Peter Spain Ph.D., Teledyne RD Instruments

Current Profiling

ADCPs are sonar systems that measure motion underwater. Using sound waves, they work like hand-held radars used by police to catch speeding motorists. To measure motion, ADCPs emit sound bursts along beams angled upward or downward.

Echoes are returned due to scattering off particles. Because zooplankton and suspended sediments are carried by the moving water, echoes scattered off them carry a change in pitch; this is the Doppler Effect. It tells how fast the current is moving and in what direction.

Sound waves propagate through the water column so echoes are returned and processed from many depths. The vertical range of this collection of measurements—called a profile of ocean current velocities—is greater for lower frequency sound waves.

Introduction

Next to the eastern seaboard of continents stream the largest currents on the planet. They have been well-known to seafarers for centuries. Found around the globe, these major ocean currents are energetic, narrow and deep. They exist in all ocean basins, north and south of the equator: Gulf Stream, Kuroshio, and Brazil, Agulhas, East Australian Currents respectively.

These strong currents move much warm water poleward from low latitudes; thus, they redistribute heat for the earth’s climate system. On shorter time scales, they affect regional and local weather. These flows transfer organisms, nutrients, chemicals, debris, and pollutants – all affect life in and out of the sea and along coastlines. And strong currents affect routes selected by shipping.

Crucial ocean currents have been studied to measure their structure, transport, and fluxes—and, in recent times, their changes on seasonal and longer times scales. In ball-park numbers, these flows span 100 km, move faster than 100 cm/s, and carry 100 times the outflow of the world’s largest river.

Measuring these currents has been challenging. To capture their extent, measurements need to reach deep. To resolve changes over time, measurements need to be sustained. And to survive, persistent measurement methods need to withstand the energy of these powerful currents. For example, surface drifters, floats, and gliders are quickly swept away in strong upper-ocean currents.

Figure 1. Large ADCP Buoys with Teledyne RDI ADCPs off South Africa. Credit: SAEON Egagasini Node. http://asca.dirisa.org/

Programs making long-term measurements of important currents rely on resilient moorings. And for measuring strong currents in the upper ocean, these moorings carry ADCPs.

In this two-part report, we first review some background to moorings carrying Teledyne RDI ADCPs mounted in DeepWater Buoyancy buoys. Then we look at sustained measurements of crucial ocean currents in some less-familiar places.

Figure 2. William Richardson, pioneer of Buoy Group at WHOI. Credit: Nova Southeastern University. LINK

Background

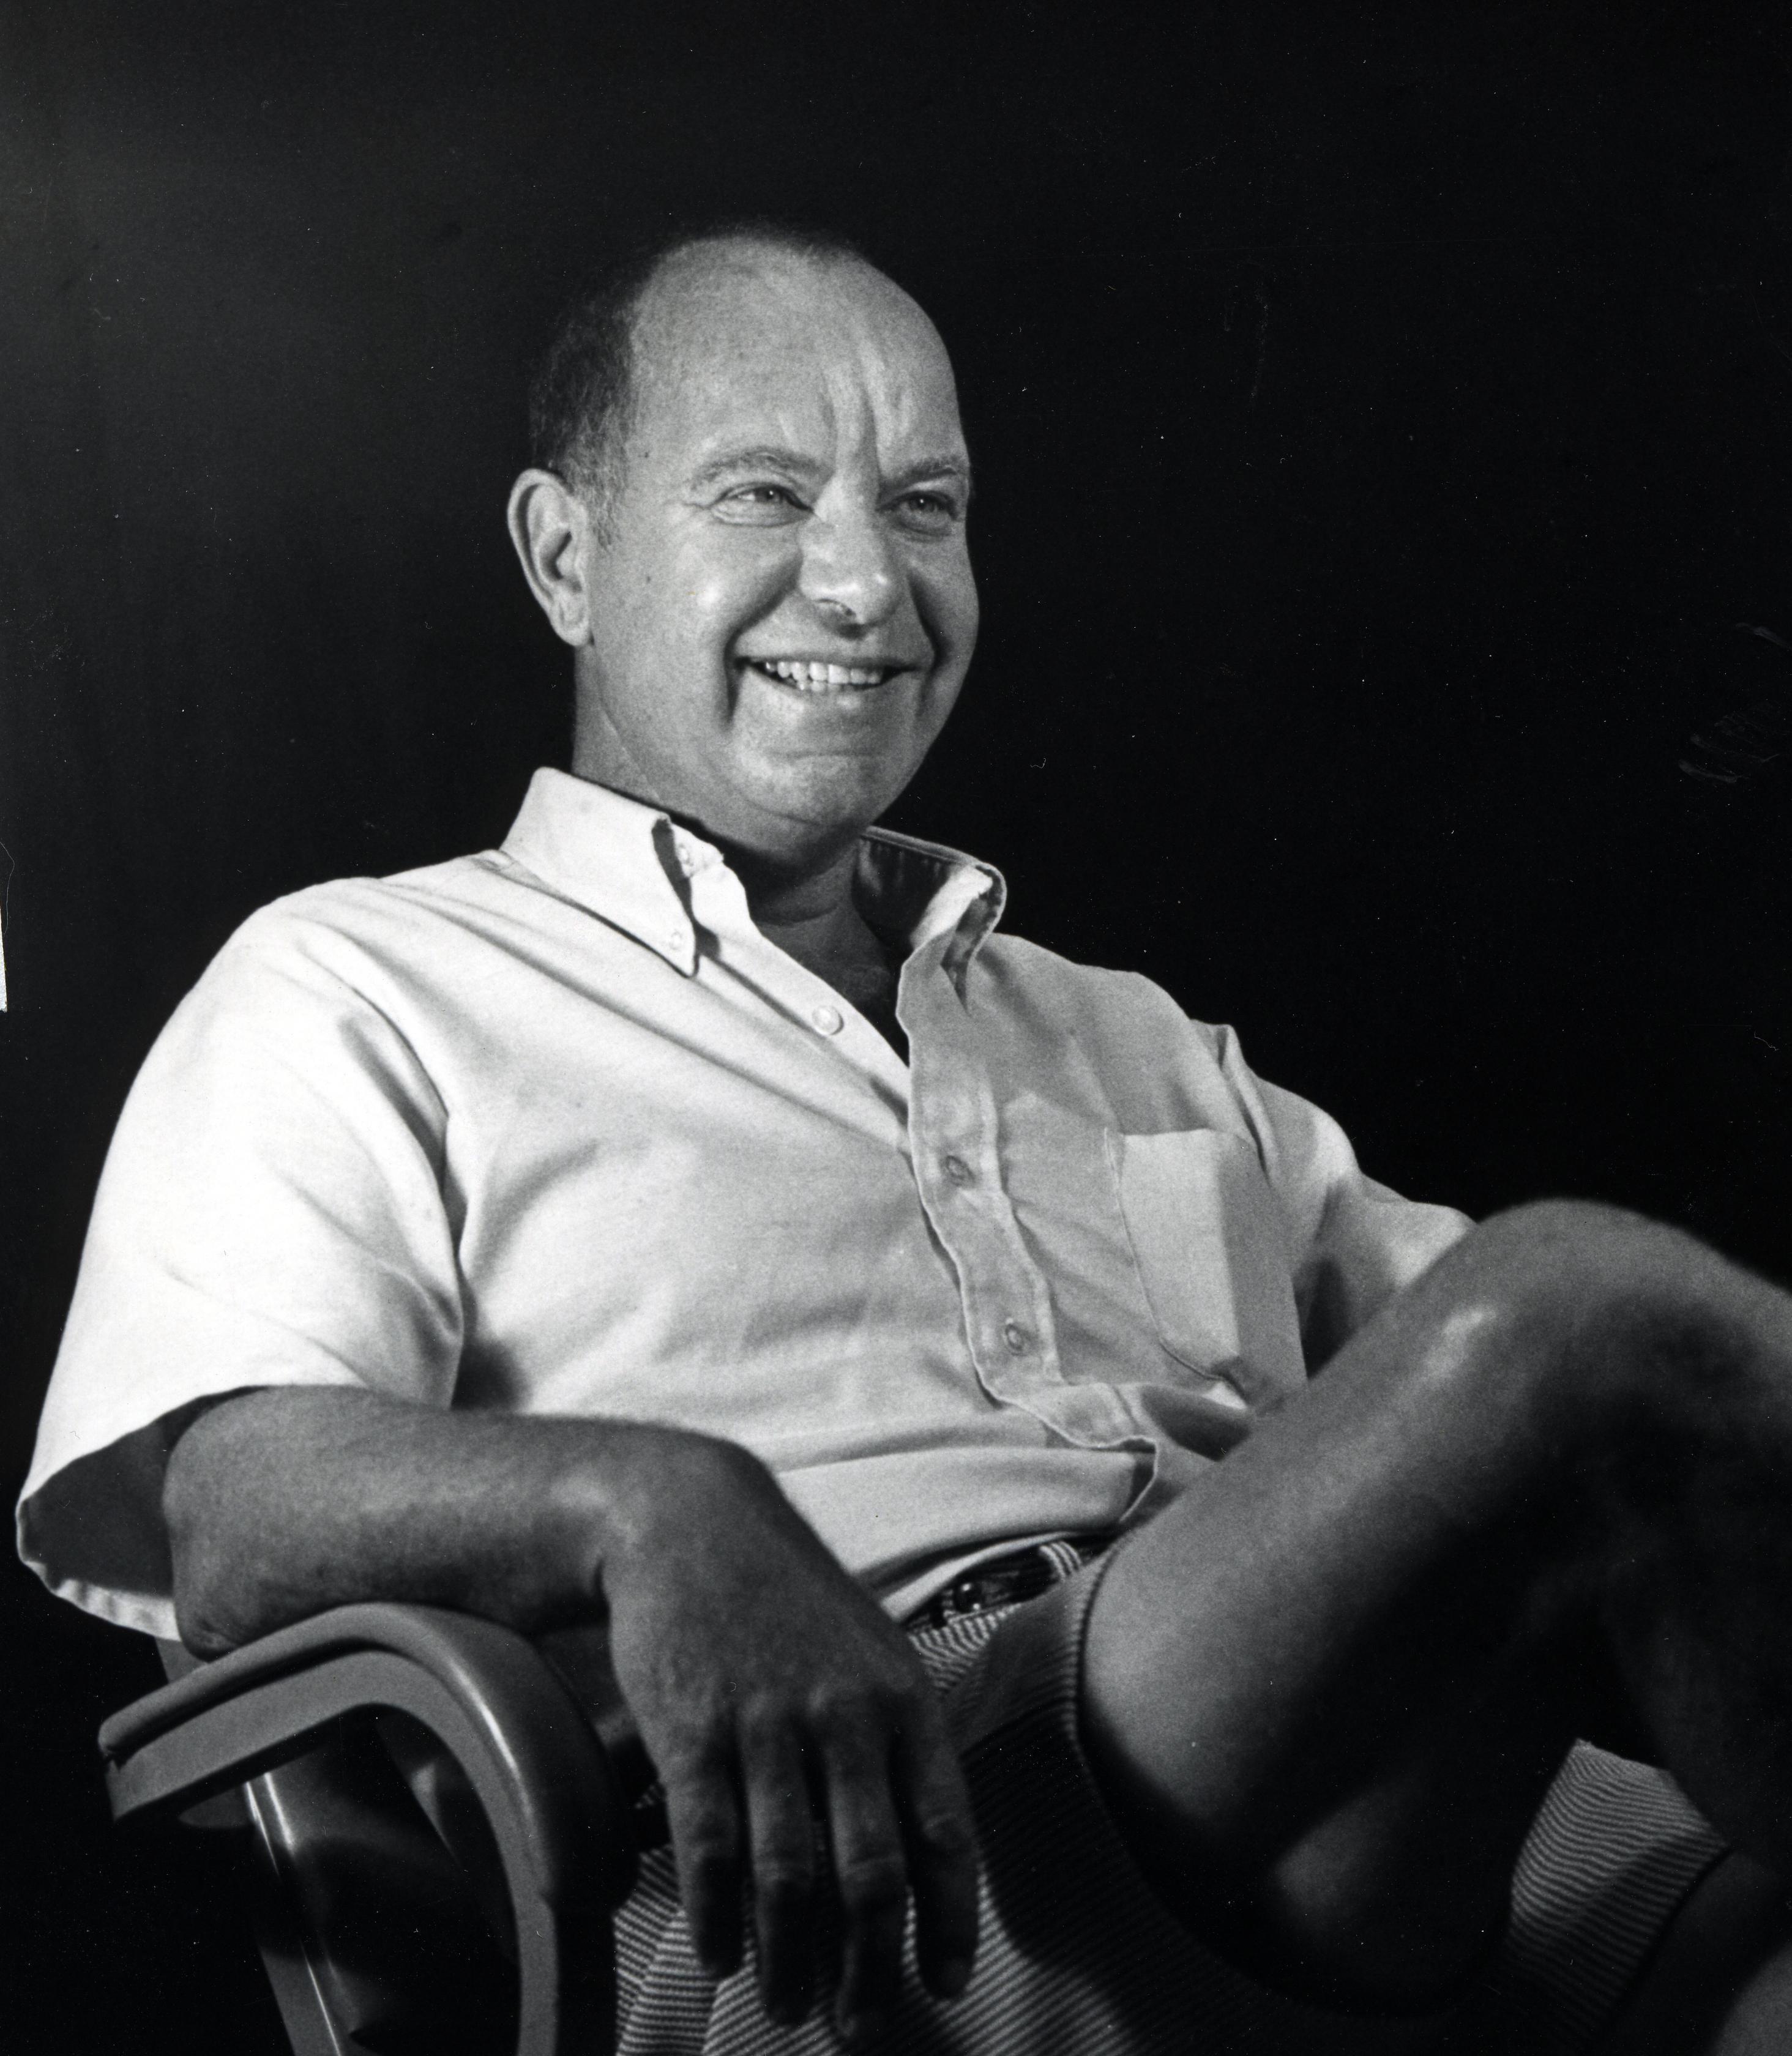
Almost 60 years ago at WHOI [1], William. S. Richardson launched the modern era of ocean-current metering. For studying deep-sea currents—notably, the Gulf Stream—he identified and invented two essential tools: a recording current meter and an unattended mooring. Richardson’s intent for the mooring was to suspend current meters at several depths. The meters would record long time-series of currents simultaneously. For studying currents across large areas, Richardson deployed several moorings.

Over the next two decades, the Buoy Group at WHOI engineered this reality. Their impressive results were hard won in the harsh and unforgiving environment of the deep sea. You can read more at this link: 50-years-of-the-whoi-buoy-group. For the UK story, see this PDF: UK_moorings.pdf.

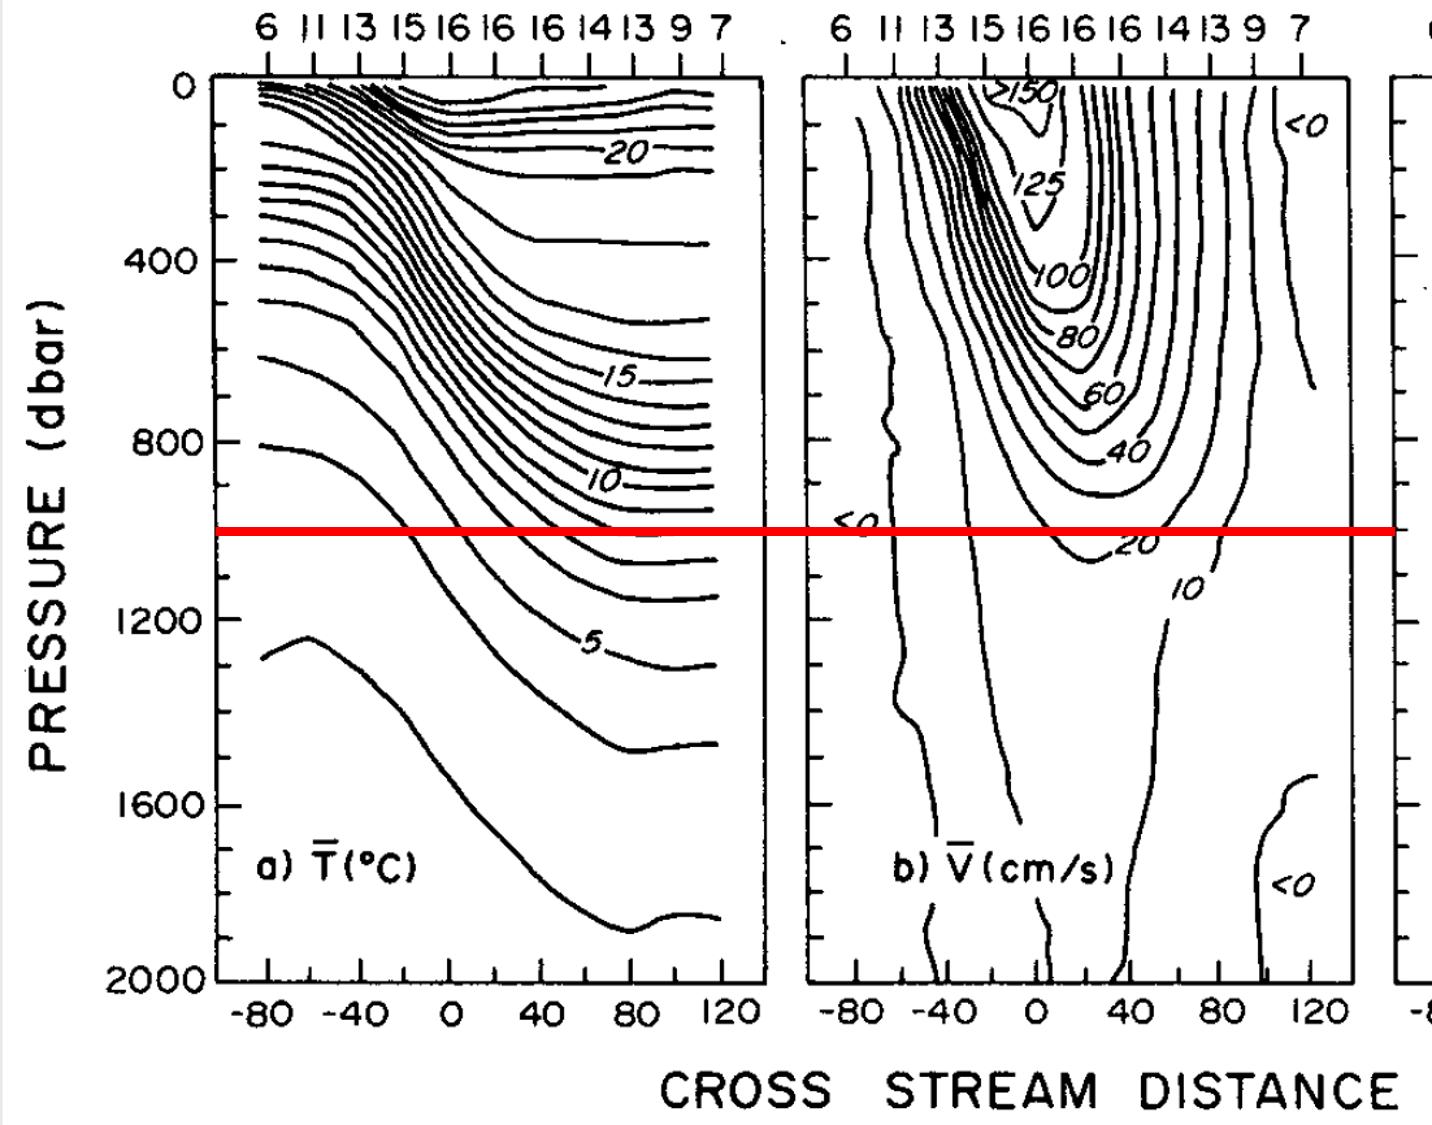
Along the way, one key problem was mooring loss. A leading culprit was large drag force caused by strong currents. The adjacent graphic shows a section of the Gulf Stream in the upper 2000 m. Speeds are directed along-stream. Notice the extreme current speeds in the upper ocean and the large spatial gradients.

[1] Woods Hole Oceanographic Institution. See Richardson et al. report (WHOI Ref: 63-1)

Figure 3. Gulf Stream currents and thermal structure. Distance: km, Current speeds: cm/s. Credit: Halkin + Rossby, 1985. LINK

For recording currents accurately, the meters need to hold position in three dimensions. The mooring must therefore be taut. To this end, sizable buoyancy is added to the mooring line. Yet, unavoidably, these elements increase drag forces exerted by strong currents.

Besides sweeping away moorings, strong drag forces caused mooring lines to pull apart (part way up) or to blow-over. The latter mooring motion carried instruments and mooring elements in large vertical excursions: 300-500 m in a tall mooring. See Fig. 4. These excursions confounded interpretation of measurements. Worse, the mooring could sink when in-line buoyancy was crushed by high pressure at unplanned depths.

Figure 4. Large vertical excursions of a mooring line in the Gulf Stream. Time series of two pressure sensors mounted in-line and separated by 200 m.  Credit: Hogg, 1986.  LINK

Mooring Changes

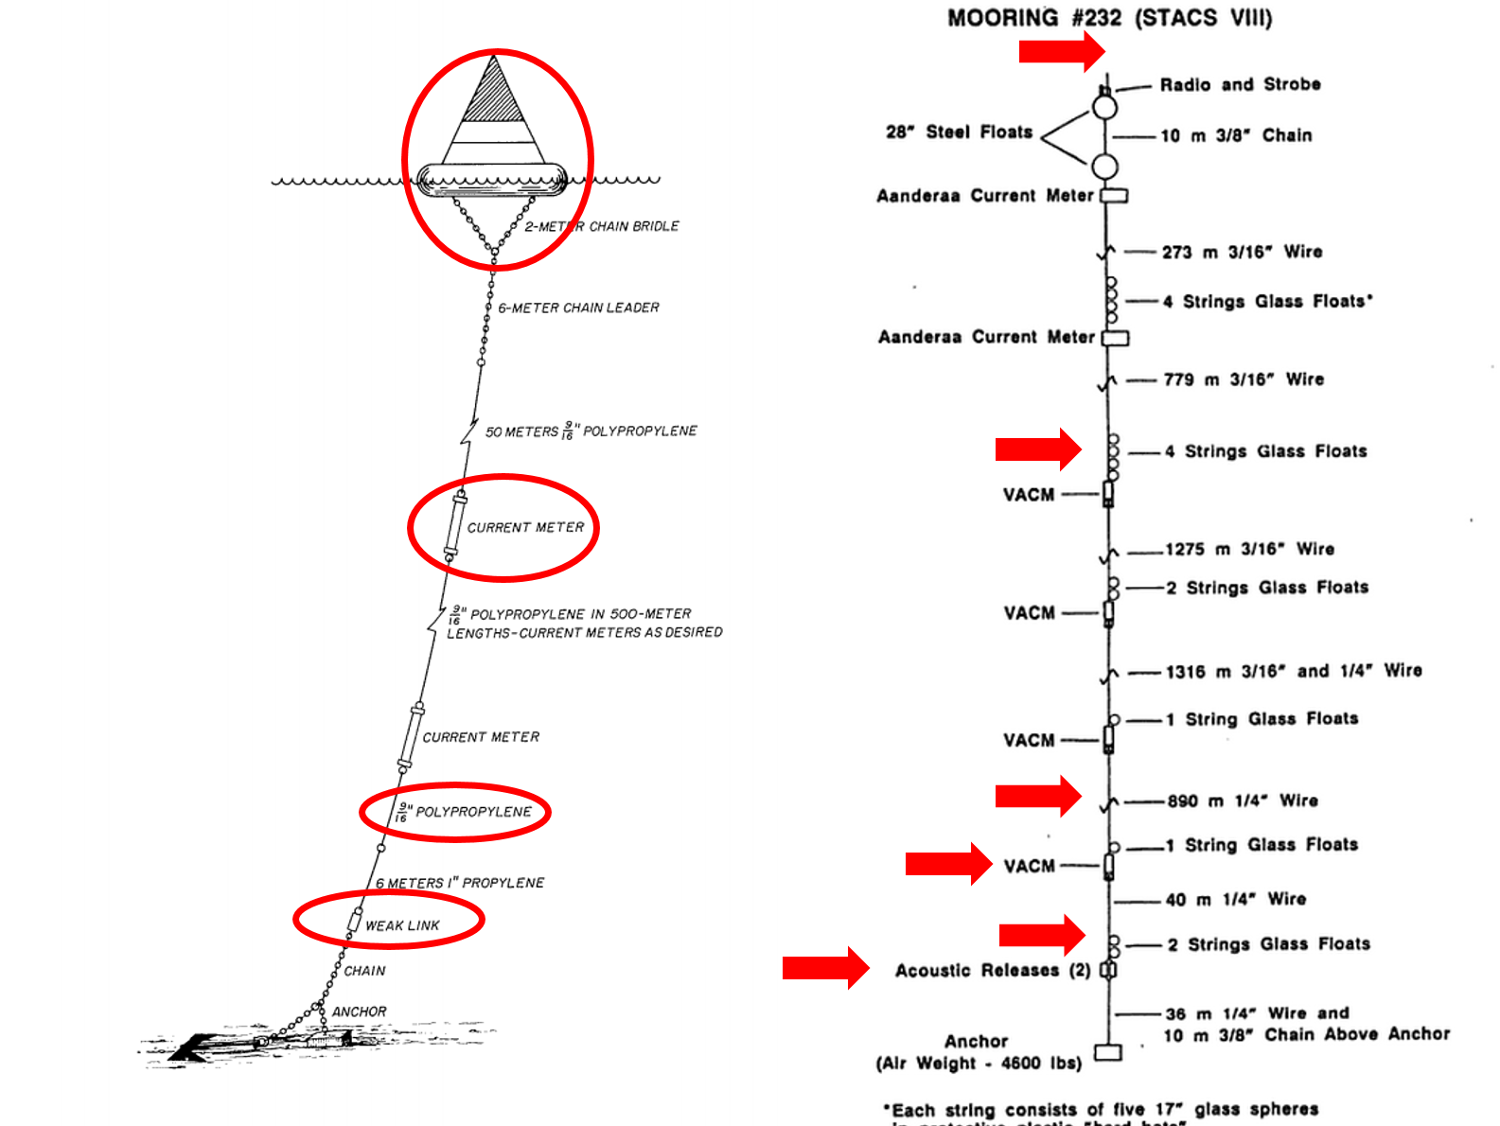
By the mid 1980’s, the design of both moorings and current meters had evolved substantially. Fig. 5 shows typical designs. Highlighted are important changes in mooring components. Notice the change in where buoyancy is added.

One strategy to decrease mooring losses was reducing drag. Major currents have strong near-surface speeds. To avoid these, moorings that terminated subsurface were developed. Many were topped with large spherical buoys. They provide the same buoyancy for less drag than smaller options. To solve the crushing problem during severe blow-over, these large spheres were made of syntactic foam.

Figure 5. Deep-sea moorings—pre ADCPs: Changes from early-1960’s to mid-1980’s. Credit: Richardson et al., 1963 WHOI Ref 63-1;  Molinari, 1986 LINK

Beginning with Hogg (1986), scientists introduced methods for correcting measurements confounded by blow-over of a mooring. As well, methods for evaluating the design and dynamics of moorings were more available. See Mooring Design and Dynamics

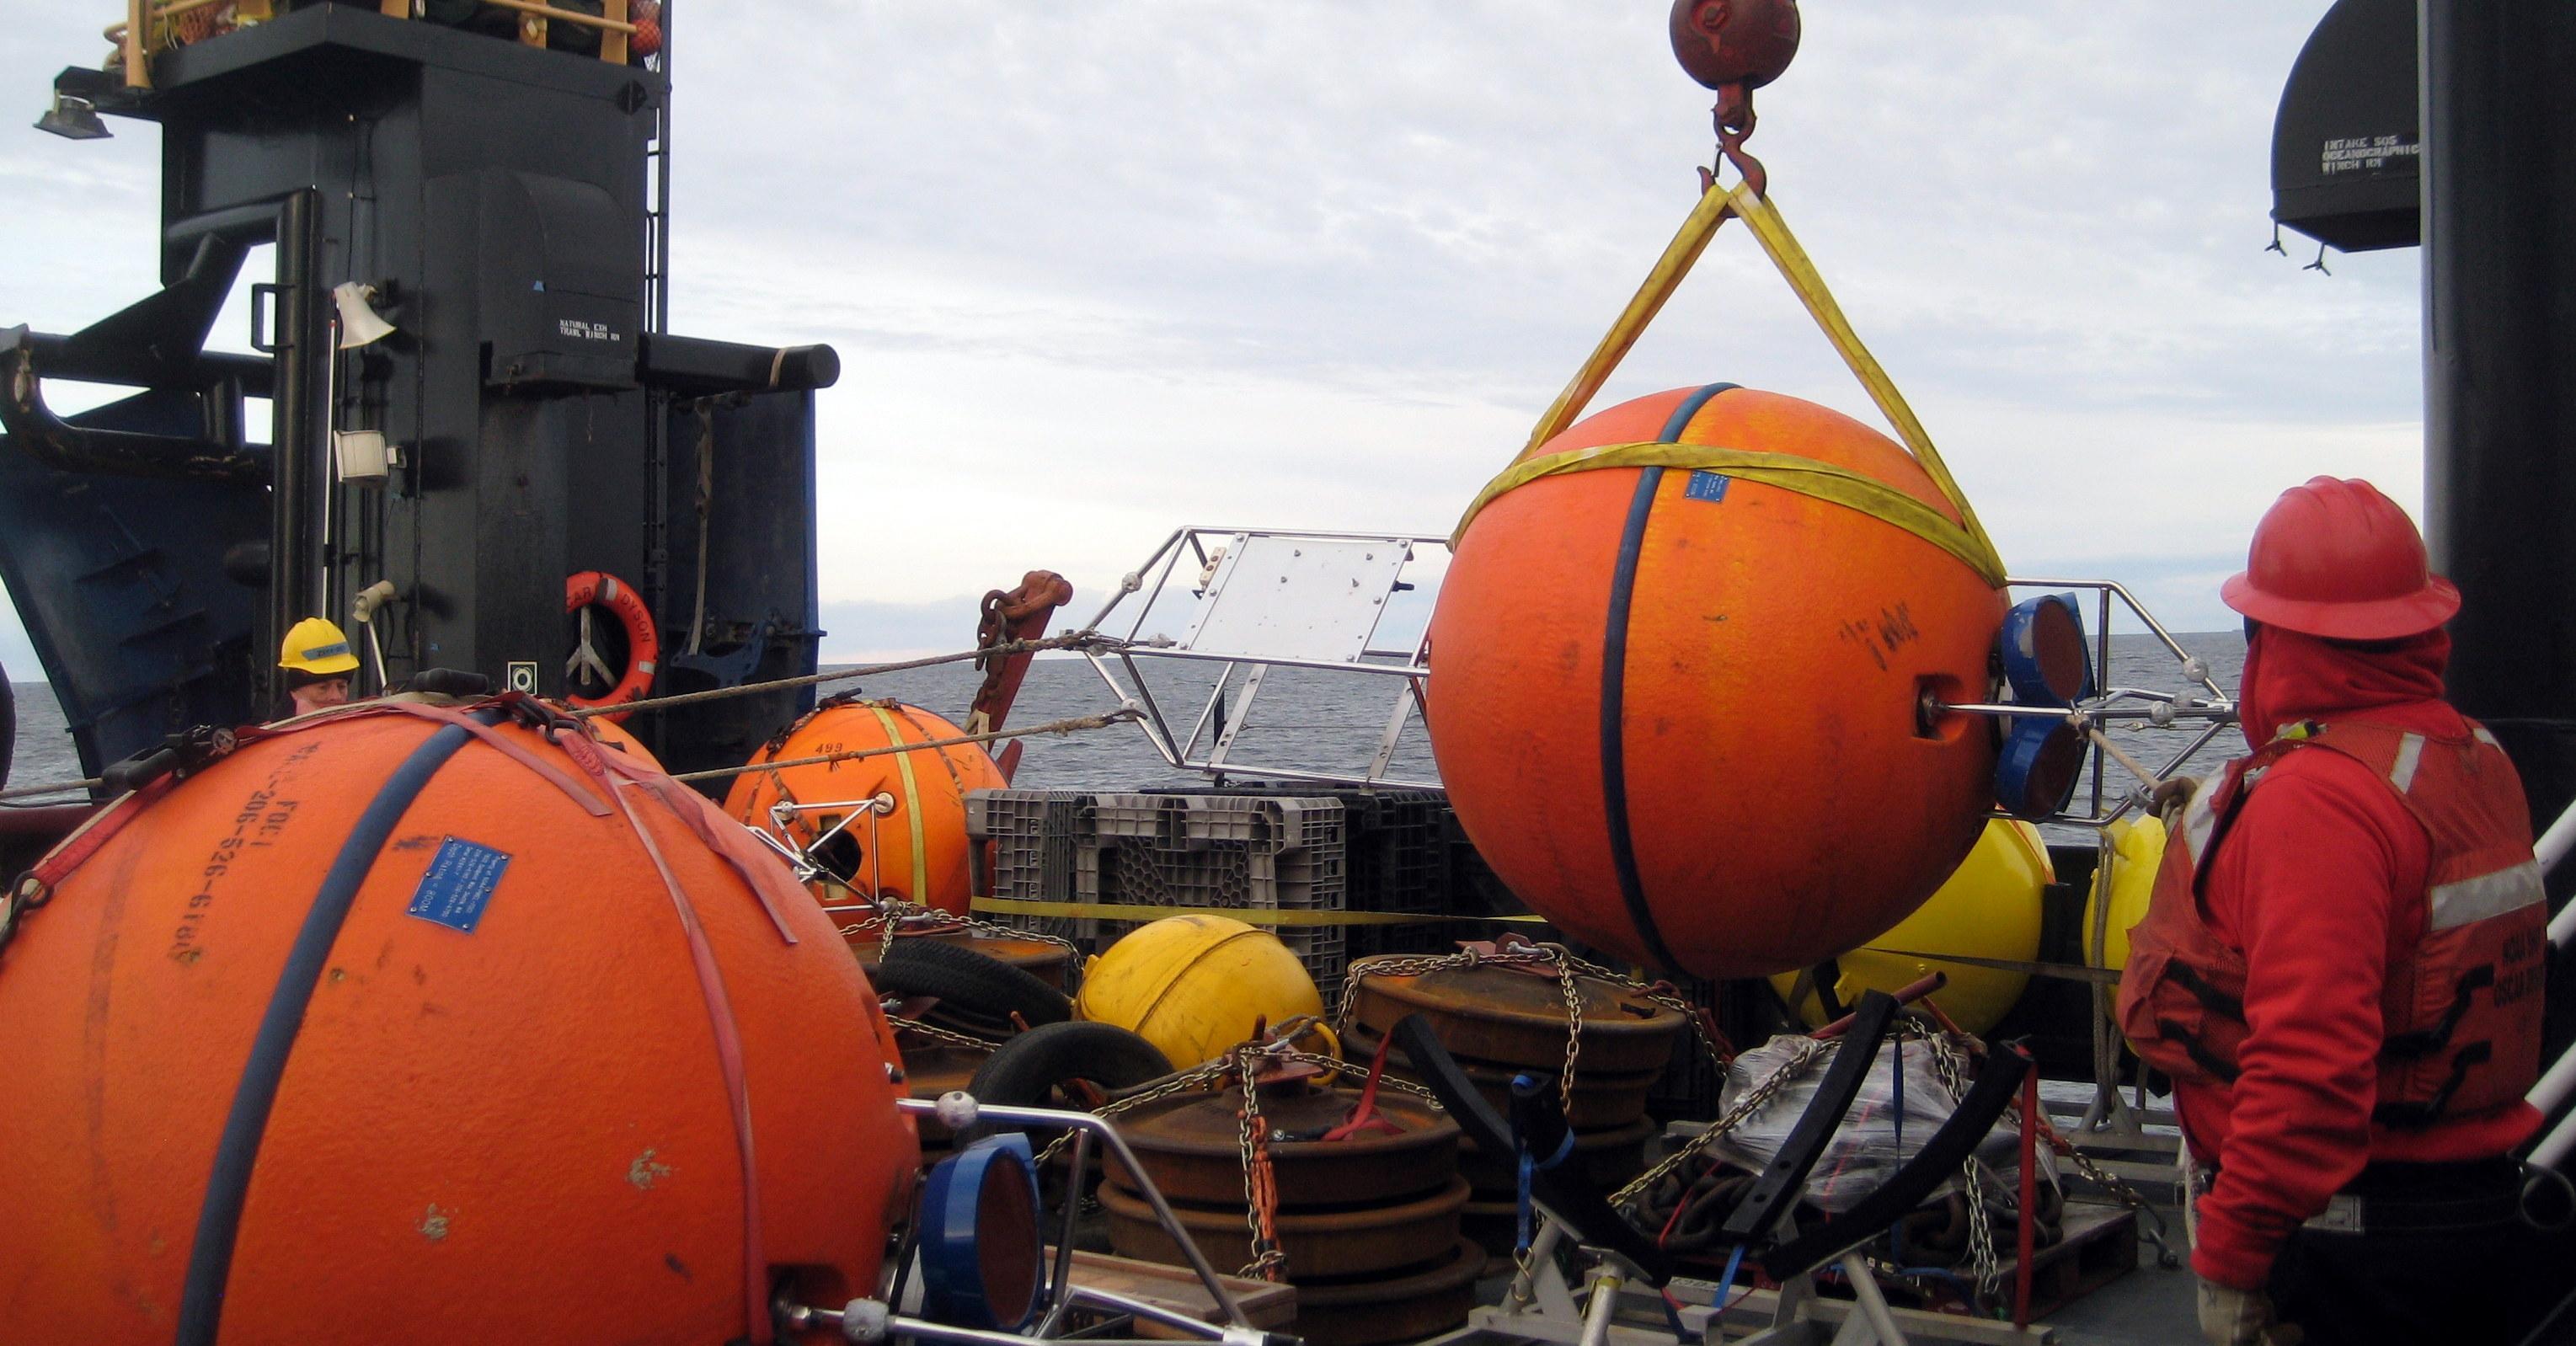
Figure 6. Spherical syntactic foam buoys housing Teledyne RDI ADCPs. Credit: NOAA. LINK

ADCPs

From the mid 1980’s, ADCPs provided a new solution for measuring strong surface currents. A mechanical current meter must be immersed in the flow it measures. In contrast, ADCPs are sonar systems; they can measure current velocity remotely. They emit an acoustic signal and then process the informational content of returning echoes.

Scientists realized that ADCPs looking upward could be used to measure strong surface currents while deployed in slower waters below. This helped reduce drag on the mooring. To this end, ADCPs were mounted in the flotation buoy atop subsurface moorings. Pioneering this approach was Friedrich A. Schott at University of Miami.

DeepWater Buoyancy’s antecedent, Flotation Technologies, developed these buoys as standard kit for ADCPs. Using syntactic foam for flotation elements permitted custom designs. Notably, a cylindrical instrument well was inserted along the vertical axis of the large spheres. Housing ADCPs in this sheltered location reduced current drag on the mooring. Since the late 1980’s, ADCPs have been commonly mounted atop a subsurface mooring within a collar of syntactic foam.

To further decrease drag on the mooring, new designs evolved for syntactic flotation buoys. An elliptical-shaped float that is more hydrodynamic became a common component on many deep sea moorings.

Figure 7. DeepWater Buoyancy Elliptical ADCP Buoy.  LINK

For measuring very strong currents, such as tidal streams, a torpedo-shaped buoy is now state-of-the-art. This approach reduces drag and increases stability in pursuit of moored nirvana—low tilt and minimal vertical excursions.

Figure 8. DeepWater Buoyancy StableMoor® Buoy holding Teledyne RDI ADCP. Credit: Bedford Institute of Oceanography. LINK

Moored ADCP Arrays

A mix of methods is needed to clarify the long-term effects of global warming. Moored arrays in major ocean currents provide an essential ingredient. Insights have come from researchers using computer models and satellite-based observations. And drifters, gliders, and floats can provide snapshots. Yet there is no substitute for hanging around in these deep and energetic flows.

For scientists to see long-term trends and large-scale connections, moored arrays must collect sustained time series. And for collecting this information Teledyne RDI ADCPs mounted in DeepWater Buoyancy flotation provide a go-to combination.

.   .   .   .   .   .   .  


In Part 2 of this report, we review some compelling examples of moored ADCP arrays measuring crucial ocean currents around the globe.

About DeepWater Buoyancy, Inc.

DeepWater Buoyancy creates subsea buoyancy products for leading companies in the oceanographic, seismic, survey, military and offshore oil & gas markets.   Customers have relied on our products for over thirty-five years, from the ocean surface to depths exceeding six thousand meters.

Learn more at www.DeepWaterBuoyancy.com

About Teledyne RD Instruments

With well over 30,000 Doppler products delivered worldwide, Teledyne RD Instruments is the industry’s leading manufacturer of Acoustic Doppler Current Profilers (ADCPs) for current profiling and wave measurement applications; and Doppler Velocity Logs (DVLs) for precision underwater navigation applications. Teledyne RDI also supplies Citadel CTD sensors for a variety of oceanographic applications.

Learn more at www.teledynemarine.com/rdi/