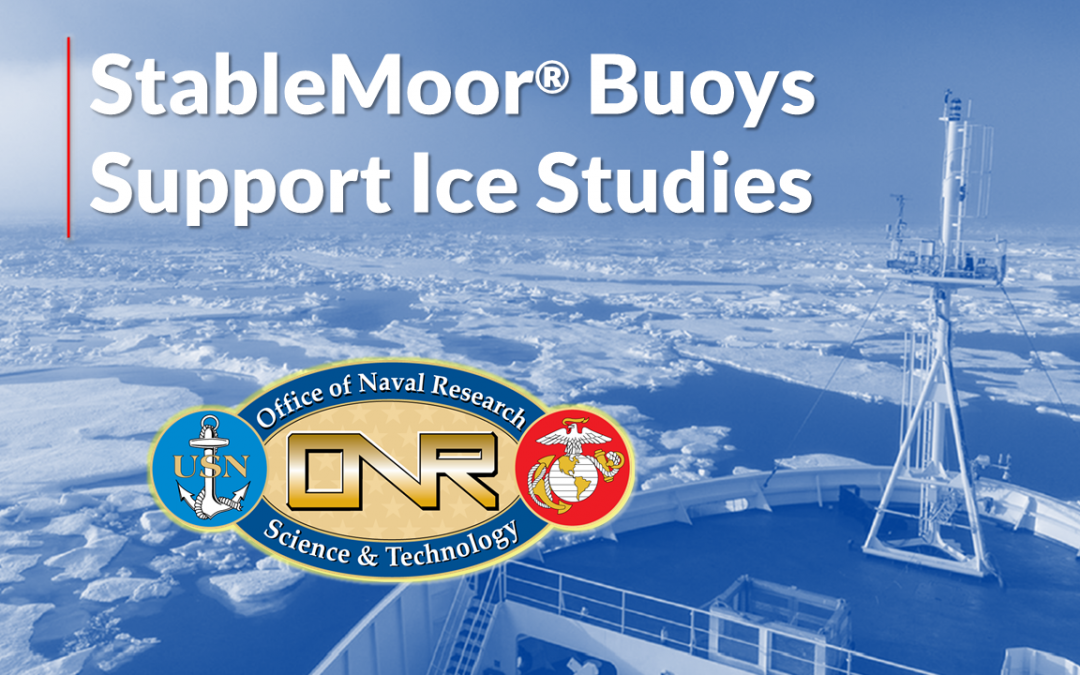
DeepWater Buoyancy’s StableMoor® Mooring Buoys have been chosen to support the “Stratified Ocean Dynamics in the Artic” (SODA) initiative headed by the Office of Naval Research.
The buoys were custom-designed and built to specifications provided by the University of Washington Applied Physics Lab and the University of New Hampshire. These buoys will support instrumentation that will map the underside of sea ice in support of the research project.
About the StableMoor® Buoys
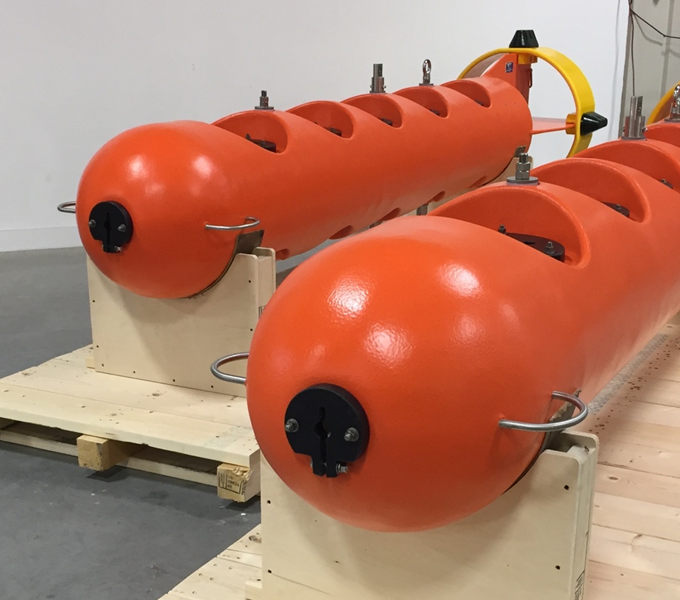
The pair of StableMoor® buoys were over 12 feet (3.5 meters) long in order to house the instruments required for the deployment. Each unit was equipped with features to allow for an upward-facing ADCP, upward facing sonar, a velocimeter, and three battery housings. Each unit provides 475 lbs (215 kgs) of buoyancy and is rated for 750 msw.
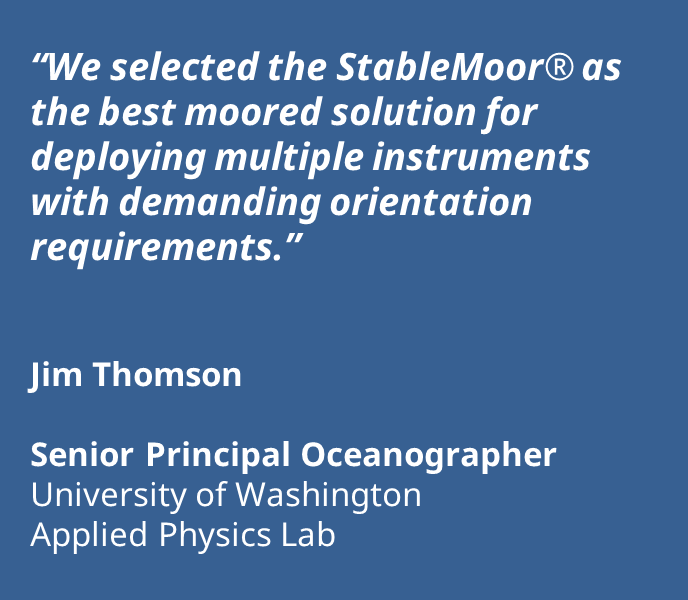
This product was chosen by the research team because of its unique performance characteristics. Specifically engineered for high current applications, the StableMoor® is designed to reduce drag and increase mooring stability in extreme flow regimes. By decreasing frontal area (compared to a standard spherical buoy) and increasing dynamic stability in high current areas, the StableMoor® minimizes mooring inclination and excursions.
Learn more about the comparison of buoy shapes in differing flow regimesHERE
The University of Washington team is well acquainted with the value of the StableMoor® design. These two buoys add to their existing units that they have been working with for the past three years. Some of these buoys previously supported a challenging NREL project studying high flow/turbulence sites for subsea turbines.
From the research paper “Stratified Ocean Dynamics of the Arctic: Science and Experiment Plan – Technical Report APL-UW 1601”, September 2016, by Craig M. Lee et al.
Vertical and lateral water properties and density structure within the Arctic Ocean are intimately related to the ocean circulation, and have profound consequences for sea ice growth and retreat as well as for propagation of acoustic energy at all scales. Our current understanding of the dynamics governing arctic upper ocean stratification and circulation derives largely from a period when extensive ice cover modulated the oceanic response to atmospheric forcing, resulting in weak seasonality, at least within the deep basins.
Recently, however, there has been significant arctic warming (Overland et al., 2016), accompanied by changes in the extent, thickness distribution, and properties of the arctic sea ice cover. Summertime sea ice extent has been declining since at least 1979 (when satellite-borne passive microwave sensors began providing comprehensive ice maps; Perovich et al., 2012), with a trend of –13.4% per decade relative to the 1981–2010 average (Figure 1; Perovich et al., 2015; Thomson et al., 2016). September sea ice minimum extents from 2007–2015 are the lowest in the 1979–2015 period, with a record minimum of 3.39 million sq km in 2012.
Figure 1. Time series of Northern Hemisphere sea ice extent anomalies in March (the month of maximum ice extent) and September (the month of minimum ice extent). The anomaly value for each year is the difference (in %) in ice extent relative to the mean values for the period 1981–2010. The black and red dashed lines are least squares linear regression lines. The slopes of these lines indicate ice losses of –2.6% and –13.4% per decade in March and September, respectively. Both trends are significant at the 99% confidence level. From Perovich et al. (2015).
Sea ice has become younger alongside the decreases in extent (Figure 2). Sea ice thickness typically increases with age, such that the combined trends toward decreasing extent and younger mean age point to a persistent loss of sea ice volume (Kwok et al., 2009; Schweiger et al., 2011). Thinner, younger ice tends to be weaker, more subject to deformation and fracturing, and thus more mobile and more likely to provide efficient coupling between the atmosphere and upper ocean. Furthermore, the growing summertime expanses of open water provide periods when the dynamics might more closely resemble those that govern the upper ocean at lower latitudes.
The need to understand these changes and their impact on arctic stratification and circulation, sea ice evolution, and the acoustic environment motivate the Office of Naval Research (ONR) Stratified Ocean Dynamics of the Arctic Departmental Research Initiative (SODA DRI).
Figure 2. A time series of sea ice age in March from 1985 to the present (top) and maps of sea ice age in March 1985 (lower left) and March 2015 (lower right). From Perovich et al. (2015).
DeepWater Buoyancy creates subsea buoyancy products for leading companies in the oceanographic, seismic, survey, military and offshore oil & gas markets. Customers have relied on our products for over thirty-five years, from the ocean surface to depths exceeding six thousand meters.
DeepWater Buoyancy was found In Print in the December Issue of the Marine Technology Reporter. The article was called “Don’t Let the Ocean Knock You Down”. Written by Dean Steinke of DSA, the article is a print version of the DeepWater Buoyancy Mooring Matters article, Mooring System Numerical Modeling.
In the article, Dean discusses the role of finite element-based simulation and visualization software in mooring design.
DeepWater Buoyancy creates subsea buoyancy products for leading companies in the oceanographic, seismic, survey, military and offshore oil & gas markets. Customers have relied on our products for over thirty years, from the ocean surface to depths exceeding six thousand meters.
DeepWater Buoyancy, Inc. has added a new product to their successful line of Mooring Line Cable Fairings. The new fairing is designed to accommodate 1/4″ jacketed wire rope. It is the latest item in the company’s portfolio of products for subsea mooring systems.
Vortex-induced Vibration
Under certain flow conditions, taut mooring lines can vibrate or “strum”. The strumming is caused by vortices that result from the water passing over the line diameter. Strumming not only creates cable fatigue, it can have a detrimental effect on instruments in the mooring string.
Mooring Line Cable Fairing
DeepWater Buoyancy’s mooring line cable fairings reduce strumming by eliminating this vortex action. Less strumming means less fatigue on the line. Additionally, the fairing design reduces drag on the mooring line resulting in less mooring layover. As an example, the drag coefficient for a 3/8” jacketed wire cable is 1.20, whereas the mooring line fairing is 0.17. This is an improvement of over 85%.
Fairings are made of durable ABS plastic. They are easily loaded onto the mooring line during deployment simply by separating the ends of the fins and installing over the line.
Unlike other solutions, this product can be installed over select portions of the line, requires no maintenance, does not suffer from tangling problems, and resists biofouling.
The standard units are designed for 1/4″ and 3/8″ jacketed wire rope and are 12” in length. Other diameters and lengths can be produced upon request. End clamps are also available to limit the vertical movement of the fairing on the line.
DeepWater Buoyancy creates subsea buoyancy products for leading companies in the oceanographic, seismic, survey, military and offshore oil & gas markets. Customers have relied on our products for over thirty-five years, from the ocean surface to depths exceeding six thousand meters.
For further sales information: Dan Cote, Sales Manager | sales@deepwb.com | +1 207 502 1400
For further company information: David A. Capotosto | davidcap@deepwb.com | +1 207 468 8545
For the next installment in our series of technical articles, Dean Steinke of Dynamic Systems Analysis Ltd., discusses the role of finite element-based simulation and visualization software in mooring design.
He demonstrates this capability with a video of the simulation showing an analysis of our three different ADCP buoy geometries – spherical, elliptical and the unique StableMoor® design.
Mooring System Numerical Modeling
“Don’t let the ocean knock you down.”
Using dynamic analysis software to assess mooring deployment, recovery, and performance in current and waves. By Dean Steinke, PEng – April 5, 2017
Introduction
For many years moorings have been designed using basic mass-drag-buoyancy calculations, spreadsheets, rules-of-thumb, black magic scripts, and a dose of ‘salty-sea-dog’ experience. With these methods, we can frequently estimate a line size to use or an approximate anchor weight. But sometimes despite our experience we still have questions. This article looks at increasing the precision of mooring analyses using numerical modeling software designed for ocean engineers.
Software for single point moorings has come a long way in recent years. Finite element-based cable analysis programs have been tested and developed by oceanographic institutions and ocean engineers for various purposes (towed bodies, ROVs, moorings, etc.). However, their use has been typically limited to a few advanced numerical modelling specialists who had both the expertise and patience to wade through the complex analysis process. In recent years, increasingly-refined software has been developed. This software has benefited from increased computational power and advances in 3D graphics. We can now get a much clearer picture as to what is happening with our moorings subsurface through simulation and visualization.
The video below demonstrates an analysis carried out by my firm, Dynamic Systems Analysis Ltd, using our ProteusDS software. Based in Canada, we have cut our teeth over the last decade simulating many different types of ocean technologies, including single point moorings.
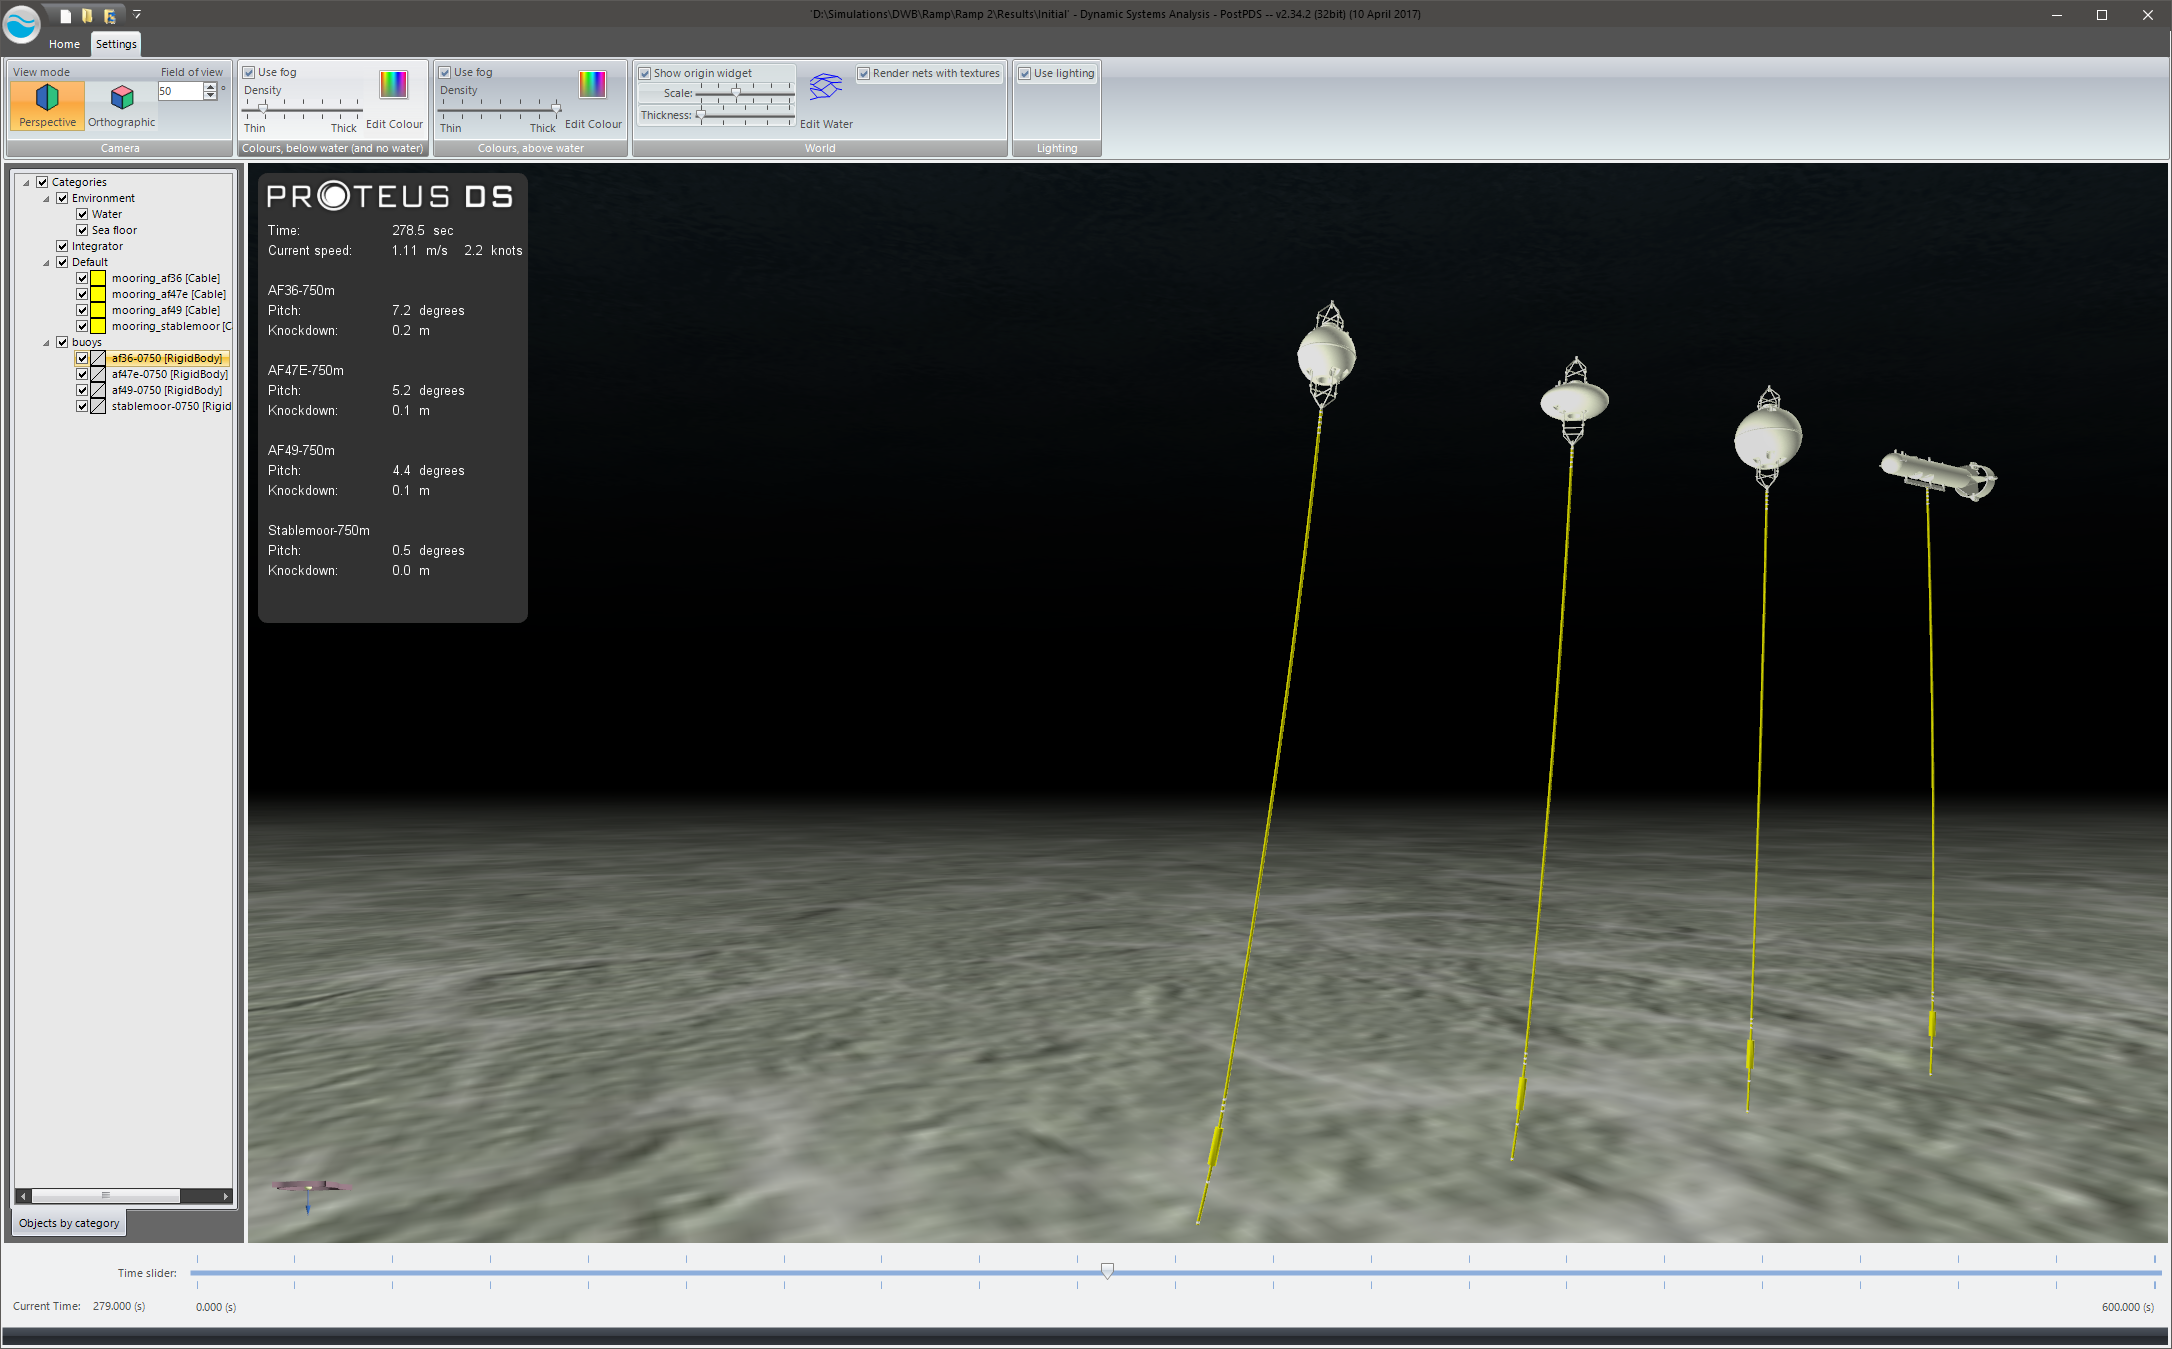
Analyzing Buoy Pitch and Knockdown in Current
The video shows four buoys of various styles (spherical, ellipsoid, and streamlined) being loaded by current. As the current ramps up to 3.6 knots, the knockdown and pitch of the buoys increase. There are two key forces at play – buoyancy and drag. The buoyancy provides a vertical restoring force that keeps the buoy from pitching. Conversely, hydrodynamic drag pitches the buoys about their mooring connection point.
A pitch of greater than 20 degrees is not recommended for ADCPs, as the inclinometers which allow for compensation of buoy pitch typically only have a range of 20 degrees. Mooring designers would try to limit ADCP buoy pitch to only a few degrees if possible. In addition to uplift and drag, buoy pitch also depends on the length of the mooring and weight of mooring equipment (chain, shackles, line, etc.).
The example shows that increased buoyancy is effective in preventing knockdown and limiting pitch, as the AF49-750 buoy has the lowest pitch and knockdown of the elliptical and spherical buoys. However, this buoy still pitches significantly at the higher currents, whereas the streamlined StableMoor® buoy, with its reduced drag and configurable connection point, is effective at maintaining low pitch and knockdown.
The ProteusDS model uses 6 degrees of freedom for the buoys (heave, sway, surge, roll, pitch, and yaw). Although this case is essentially 2D, the solver solves for the position in 3D. The effect of the attachment point and location of drag loading affect the pitch calculated by the software.
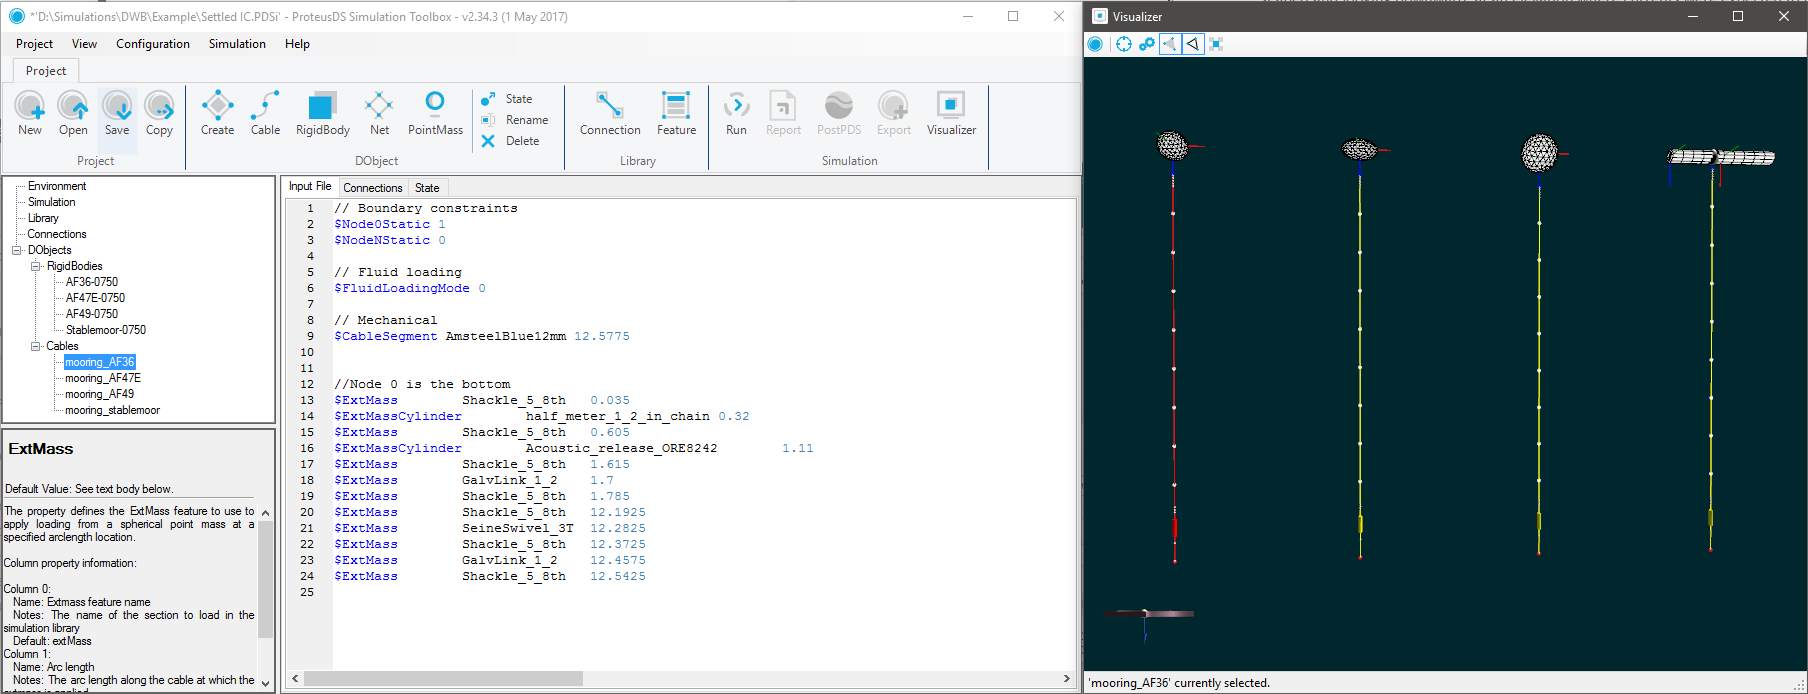
Figure 1 The ProteusDS software pre-processor is shown. This software allows users to add mooring elements such as shackles and swivels from a central library. Line types such as Amsteel Blue or wire rope can likewise be selected.
Transient Loading and Acoustic Release Damage During Mooring Deployment
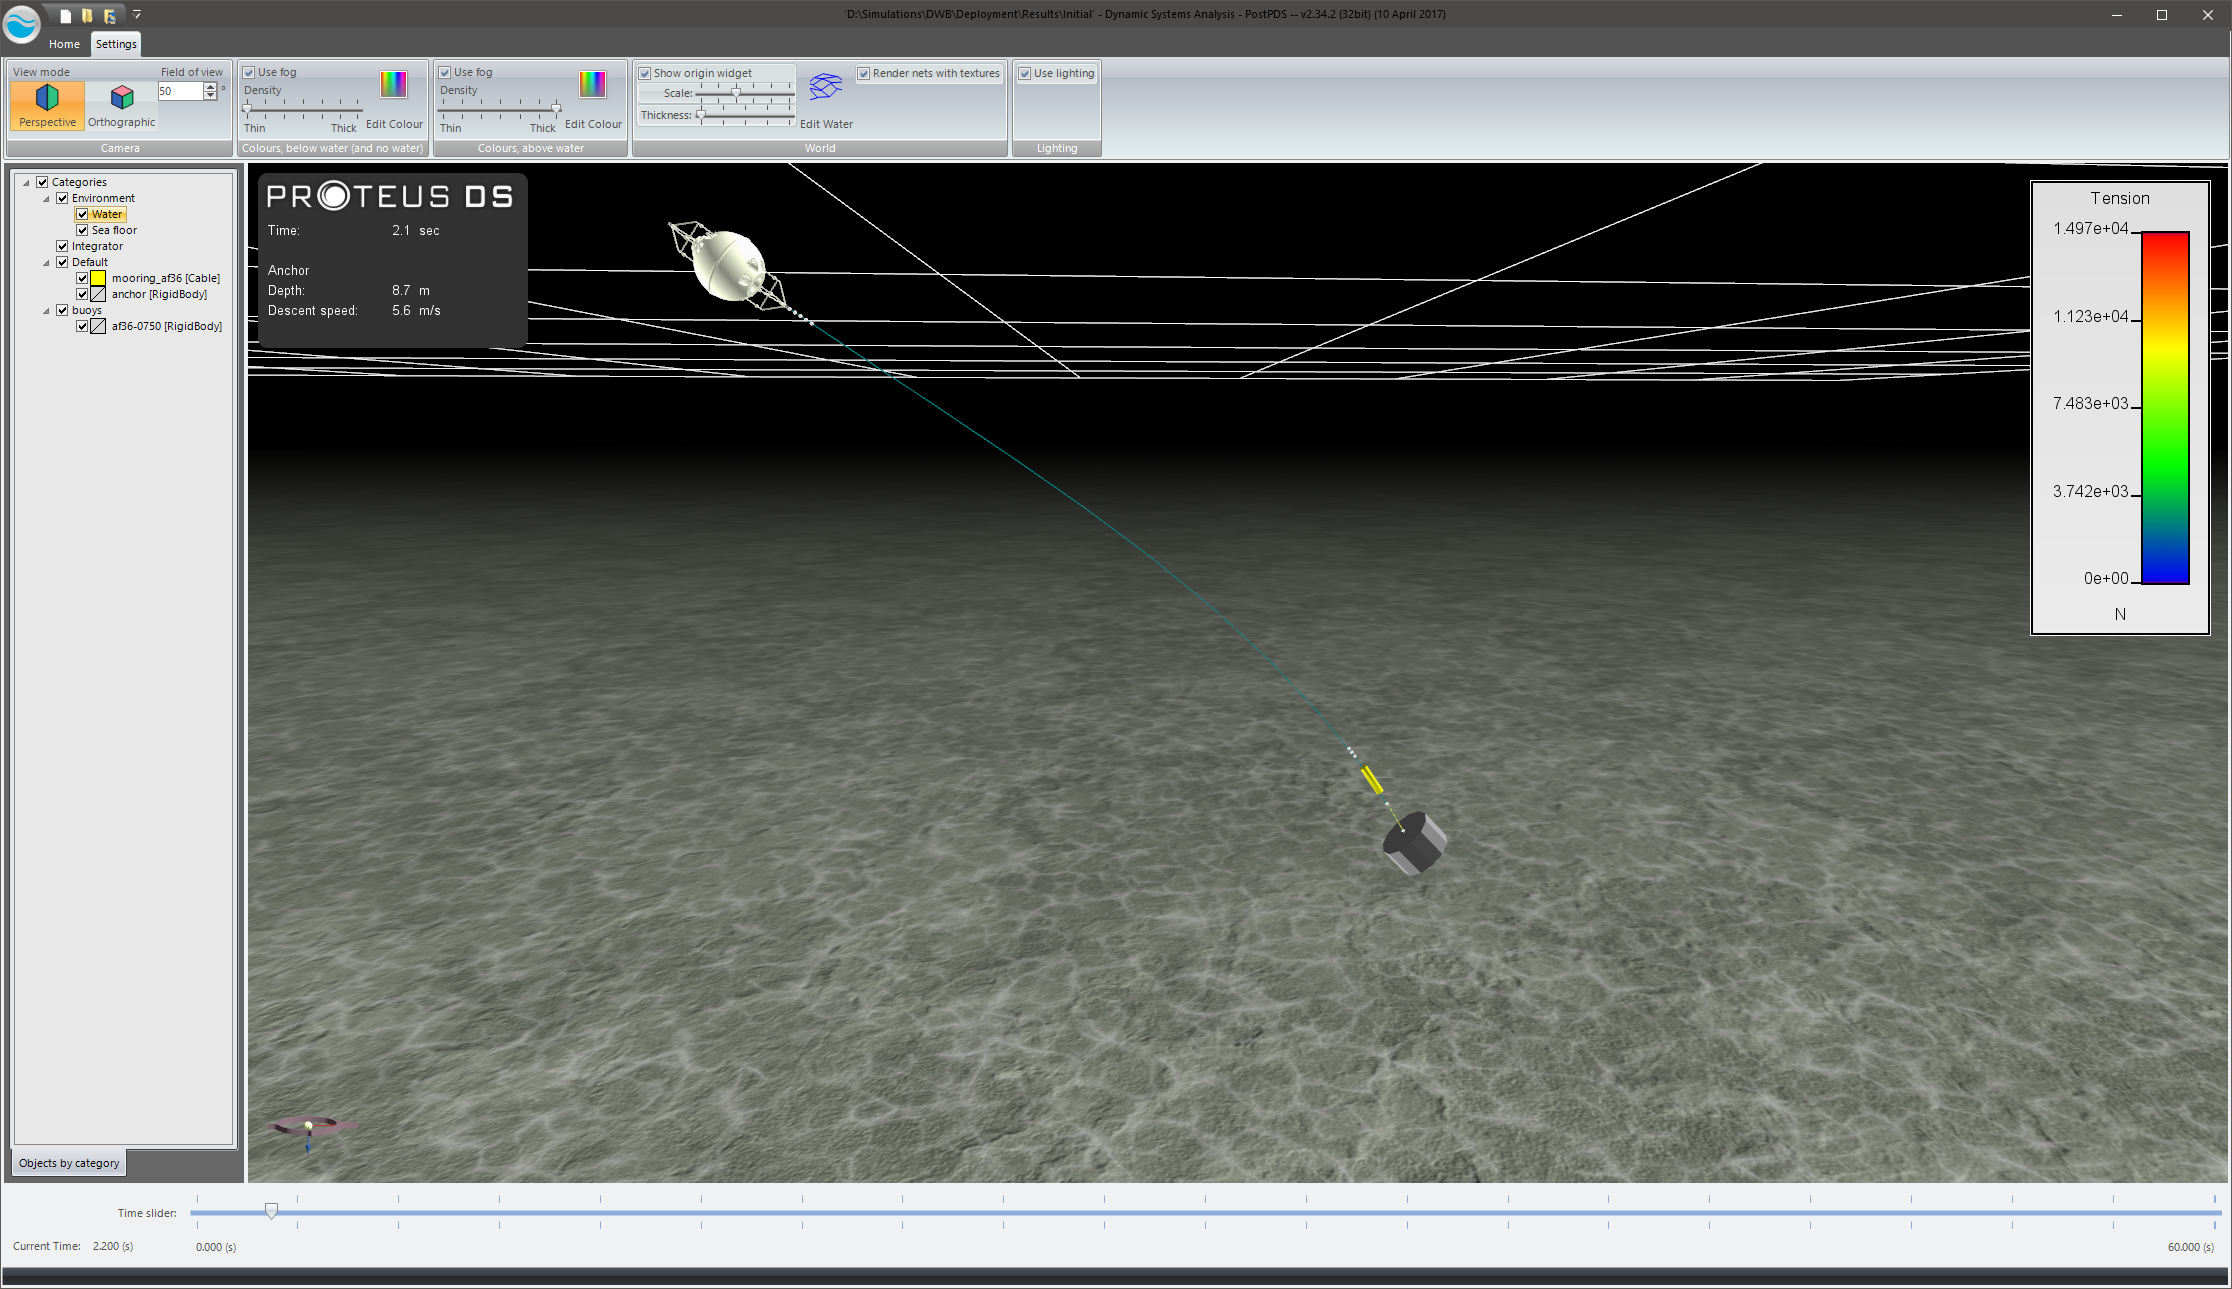
One aspect not often considered by mooring designers is what happens during deployment. As shown in the video, the simulation allows for prediction of launch transients, which ensures that shackles and lines are properly selected to handle the deployment loads.
We’ve observed that acoustic releases get damaged during deployment when they are placed too close to the anchor. ProteusDS can be used to check that the acoustic release’s downward momentum will not cause it to crash into the seabed or anchor.
A few questions I’m asked from time to time are: How long will it take for the mooring to come to the surface? and, How far might the mooring drift as it comes to the surface? The mooring recovery section of the video shows how you can assess this.
In the case considered, the AF36-750 mooring rises at about 2.7 meters per second. If this mooring was deployed at 750 meters, it would take between 4 and 5 minutes to surface!
Although no current was applied in the example, current can be applied in the simulation to determine how far it might drift in the time it takes to get to the surface.
Figure 3 ProteusDS post-processing software showing rendered view of the mooring systems being tested.
Interaction of Waves with Subsurface Moorings
Much like current, waves can cause an ADCP mooring to pitch and move. The example in the video shows the impact of the subsurface orbital wave motion on the mooring line and buoy. A JONSWAP wave spectrum is simulated to check how much the buoy will pitch. Clearly, in this case, a bottom mounted ADCP frame would be preferred – but we don’t always have the equipment we need on hand. It’s good to have tools to check the impact of waves on our moorings.
Conclusions
DSA has carried out a series of simulations in consultation with DeepWater Buoyancy using our ProteusDS software. The software is designed to help mooring designers and builders to answer practical questions about mooring performance. Most would agree that the software’s 3D visualization capabilities shown in the video are really cool, but I believe that the real value of the software is that we don’t have to speculate what is happening subsea. We can now get a clear picture.
About Dynamic Systems Analysis Ltd.
Dynamic Systems Analysis Ltd. is an ocean engineering consultancy and software company based in Canada. DSA provides progressive and accessible dynamic analysis expertise and software to enable those working with vessels, structures, lines and technologies in harsh marine environments to reduce risk. DSA provides software and services to the aquaculture & fisheries, defence, marine renewable energy, naval architecture, ocean technology, and offshore sectors.
DeepWater Buoyancy creates subsea buoyancy products for leading companies in the oceanographic, seismic, survey, military and offshore oil & gas markets. Customers have relied on our products for over thirty years, from the ocean surface to depths exceeding six thousand meters.
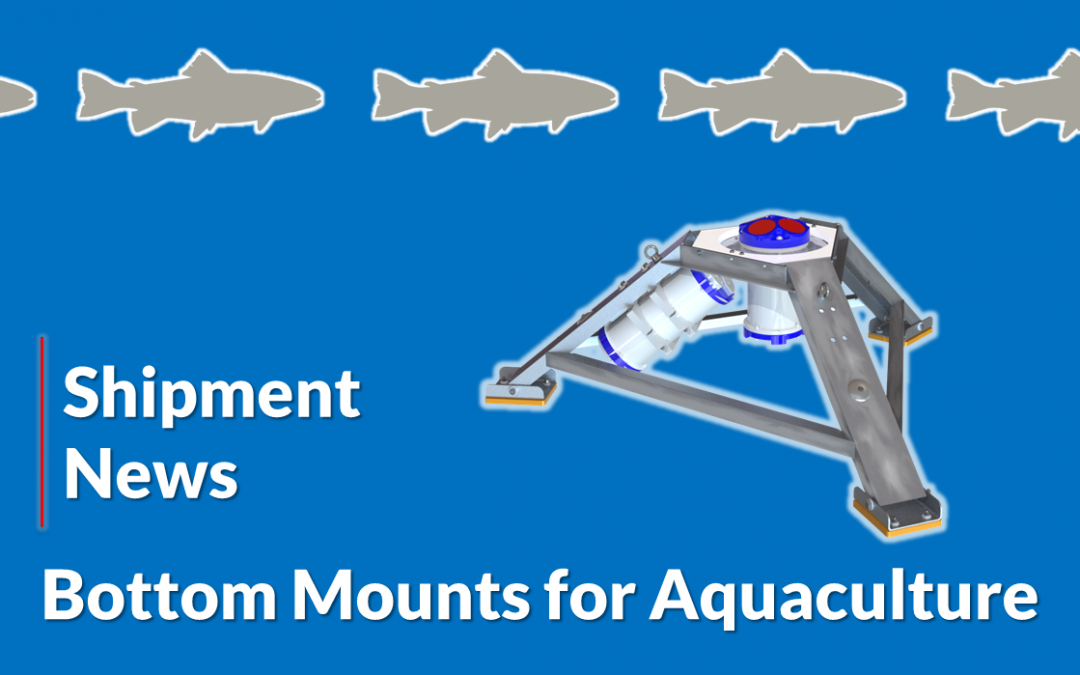
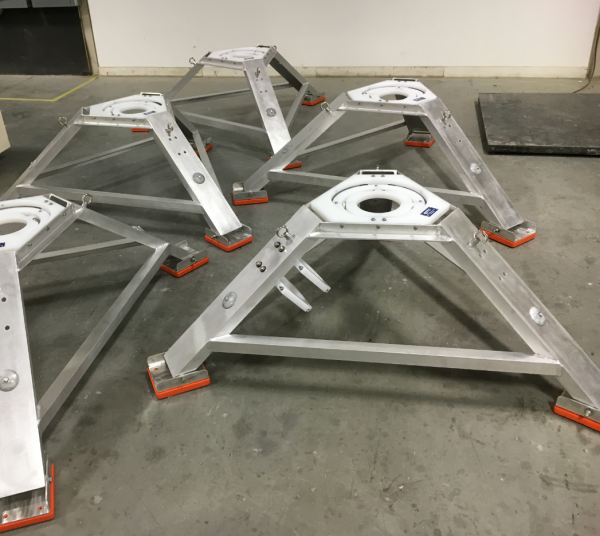
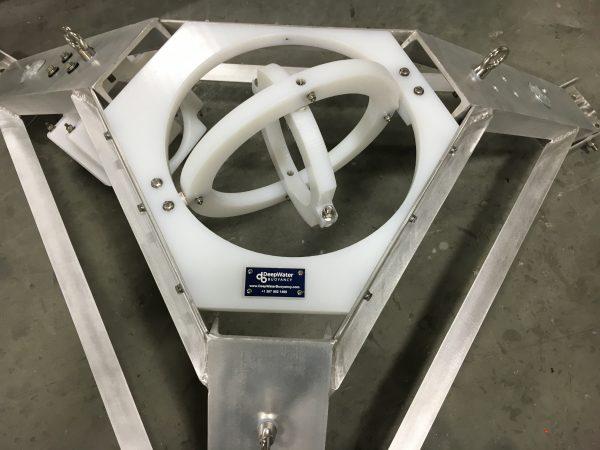
DeepWater Buoyancy, Inc. announced the delivery of a significant follow-on order of diver-serviceable bottom mounts for one of the world’s largest fish farming companies. The bottom mounts are set on the seafloor at a depth of 50 to 100 meters and allow for the proper deployment of ADCPs to monitor the environment around the fish farm cages.
ADCP’s are used in aquaculture applications in order to monitor currents and waves for the following main purposes:
Investigate new fish farming areas
Monitor currents when feeding in order to minimize feed loss
Monitor fish waste for pollution plumes
The order was secured by DeepWater Buoyancy’s UK representative, Saderet Ltd. Saderet is the exclusive distributor of DeepWater Buoyancy products in the UK. Saderet also represents Teledyne RD Instruments, makers of the Sentinel V50 ADCP, which was chosen for this application.
DeepWater Buoyancy, Inc.’s recently retooled BTM-AL50 diver-serviceable bottom mount line is equipped with a two-axis gimbal to mount an ADCP, clamps for a remote battery housing, and zinc anodes for corrosion resistance. The three articulating footpads are provided with standard urethane-coated ballast, with additional ballasting provided for this application.
The client was pleased with the performance, delivery, and quality of the equipment supplied in the first order, as well as the ongoing technical support provided by Saderet, DeepWater Buoyancy and Teledyne RDI.
About Saderet Ltd.
Saderet Ltd. specialize in the supply of survey and positioning equipment and services to a wide variety of markets including marine and land survey, GIS, oceanography, precision agriculture, and OEM. Presenting some of the best manufacturers of survey related equipment in the world, we deliver products worldwide.
DeepWater Buoyancy creates subsea buoyancy products for leading companies in the oceanographic, seismic, survey, military and offshore oil & gas markets. Customers have relied on our products for over thirty-five years, from the ocean surface to depths exceeding six thousand meters.
For the next installment in our series of technical articles, ocean engineer Jon Wood addresses an interesting question related to deployment and recovery of subsea mooring systems. Jon has decades of experience working with DeepWater Buoyancy’s oceanographic buoys.
How Fast Does a Buoy Ascend?
I’ve been asked that question frequently, since the ascent (or descent) rate of a buoy can be a consideration when planning for offshore operations. Especially for projects in very deep water, it can take a long time for a mooring to reach the seabed, and an equally long, if not longer, time for it to float back to the surface. In this article we will look at the forces involved, methodology for tracking the rate during deployment or recovery, and an example that might help you estimate.
So, “How long will it take?” The true answer is, of course, “It depends!” It depends on the buoyancy of the buoys in the mooring and the weight of the line, instruments and anchor, as well as the drag forces imposed by all of the components.
We have measured these rates during several past mooring deployment and recovery operations. By setting a hydrophone over the rail and ranging repeatedly on the mooring’s acoustic releases (4 or 10 second repetition rate, typically), we have been able to quantify both descent (deployment) and ascent (recovery) speeds for different mooring configurations. Not all scenarios are the same but these data provide some ballpark estimates that may be helpful in planning future operations.
The two main factors that affect the descent rate of a mooring are the weight of the anchor (magnitude of the downward force) and the restraining effect of buoys and other mooring components (buoyancy and drag). Within these restraining effects, the largest components are typically buoys as they have the most immediate influence.
The mooring reaches terminal velocity when the downward gravitational force equals the upward restraining force. This seems to happen quickly once all components are submerged. Upon release, the ascent rates are also governed by the magnitude of the upward forces (i.e. buoyancy), as well as the drag-imposed restraints of all mooring components.
As an example, we had a mooring consisting of a 49” spherical buoy (reserve buoyancy about 900 lbs). The buoy was connected to the anchor via approximately 1000m of wire rope. The mooring also included two smaller (35” spherical) intermediate buoys plus assorted current meters. The anchor was a 4800-pound pile of old scrap chain cobbled together from a local salvage yard. After streaming out the mooring line from the vessel and free-falling the anchor (i.e. the anchor-last technique), the acoustic releases descended to the seabed at an average rate of about 3.0 meters/second. In 1500m water depth, that translates to 500 seconds, or just over 8 minutes, for the mooring to settle. On recovery, after the mooring was released from its anchor to float freely to the surface, we found the ascent rate was quite similar, about 2.8 meters/second. Since the top buoy was positioned roughly 500m deep, it took about 3 minutes for the buoy to appear at the surface.
Here’s wishing that your next mooring deployment sees a soft landing!
Jon Wood
Ocean Data Technologies, Inc.
About Ocean Data Technologies, Inc.
Ocean Data Technologies, Inc. is a Massachusetts (United States) corporation providing oceanographic data acquisition services and support to the global offshore marine industry. Ocean Data designs and installs simple, reliable systems that collect information critical to our customer’s needs in deep-water, continental shelf, as well as nearshore and estuary regions.
DeepWater Buoyancy creates subsea buoyancy products for leading companies in the oceanographic, seismic, survey, military and offshore oil & gas markets. Customers have relied on our products for over thirty-five years, from the ocean surface to depths exceeding six thousand meters.
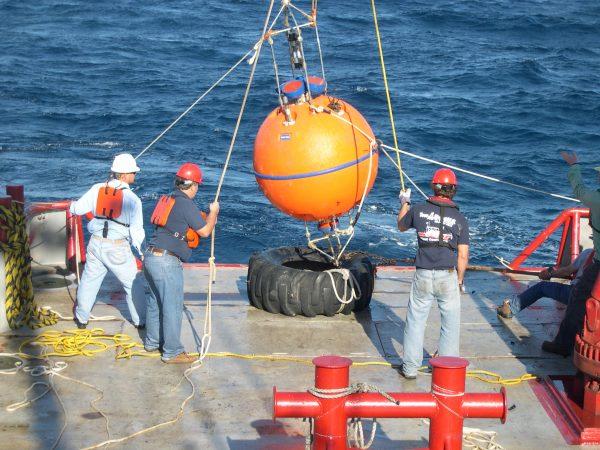
Ocean Data Technologies recovering a spherical ADCP buoy 8 miles outside of Port Everglades, Florida, in the Florida Current (Gulf Stream), aboard the M/V Richard L. Becker. The ADCP mooring was for Dr. Alexander Soloviev of Nova Southeastern University. It was deployed for nearly 4 years, with regular 6-month turnaround operations (like this one), recording an impressive data set of Gulf Stream variability.
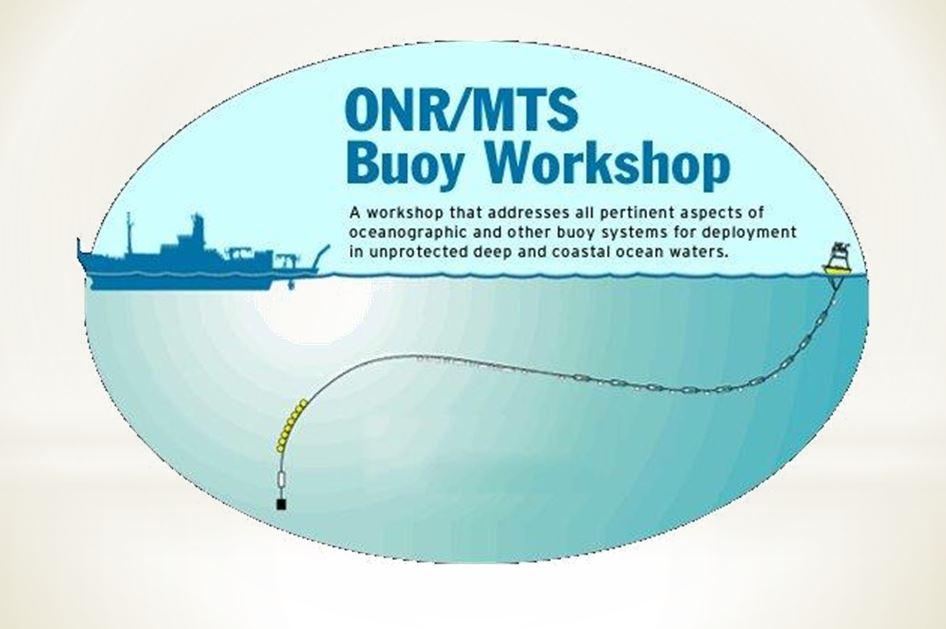
DeepWater Buoyancy is co-sponsoring and exhibiting at the 11th MTS Buoy Workshop sponsored by the Marine Technology Society (MTS).
The Workshop will be held at the Woods Hole Oceanographic Institution (WHOI), Woods Hole, Massachusetts, on Quissett Campus. The workshop will run from April 18-21, 2016.
On Friday the 22nd, participants have been invited to make the trip north to Maine for lunch and a tour of DeepWater Buoyancy’s Biddeford facility. Afterwards, participants can continue on and take a tour of the Yale Cordage facility in the neighboring town of Saco.
To sign up for the lunch and tour simply send an email to sales@deepwb.com.
DeepWater Buoyancy is co-sponsoring ADCPs in Action in Australia (AiAiA) on May 12-14. The event is being hosted by UVS Pty Ltd. UVS is a long term partner of DeepWater Buoyancy and represents us in Australia.
ADCPs in Action events are Teledyne RDI programs that are held in San Diego, India, Australia and the Netherlands.